Let’s face it executives love reports. If you work in-house, your VP or Director of Sales/Marketing just wants to see that everything is going well. If you are an agency, it’s all about those pesky reports. We are the magicians that turn tons of raw data into a multi-color rainbow of happiness.
My guess is that you use the standard reports from AdWords; keyword, ad group, and account performance reports. But here are a few more you might be missing and how they can make you look like the Rock Star you really are in the eyes of those executives.

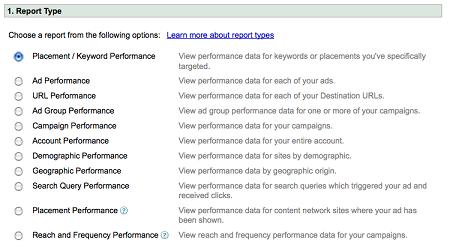
Placement Performance
This is my favorite report when I have an account running ads on the content network, especially when they are a B2B or otherwise non-teenager focused company. This report allows you to pull information on what partners on the content network are performing. It’s best to use when you have conversion tracking activated on AdWords.
1. Run the report for the past three months or so. If you don’t have conversion tracking running you should first check who is bringing you the most impressions.
2. Sort the column for impressions to start with the most first. Take a look at your top results and see which ones are converting to clicks. I am betting you will notice a lot of domains that are bringing you thousands of impressions but no clicks. *cough*MySpace*cough*
3. Get a list of those domains that aren’t converting to clicks at all. Use those as negative site matches in your campaign. Here are the directions to do that. (I am assuming that you have your content network as its own separate campaign. Please do that, it helps.)
4. Continue running this report once a month. Do NOT do it every week, that’s like checking your rankings everyday. It’s stupid and there isn’t enough data to back it up. Run the report once a month and you’ll magically start seeing better results on your content network spend.
Impression Share
This is the report that you can print out, make all pretty, point to and say “LOOK! I need more money!” I know … that works in all companies right now, right? Well with this report you can show how much traffic your campaign is missing out on due to bids and position. It comes out of the Campaign/Account Performance report. The trick is to turn off all the other data points that you usually see and focus on what you are missing.
Here are the instructions for creating this report.
Here is a look at what you might see. This report shows that this account lost almost 60% of traffic due to their ranking and 2.37% based on budget. They take in about 38% of the total impressions their account could be seeing. Not good. But in a slow economy, some of this might make sense. The report only gives you part of it, the interpretation of the data is why you have a job. *wink*

URL Performance
The final report that you should be running and most likely are not running is the URL performance report. I use this report because of special situations with certain clients. They track based upon keyword and each keyword has it’s own destination URL so they can measure performance on the back end of their internal system.
The URL performance report allows me to prepare true keyword performance reports. It might also work for those of you doing testing on keyword insertion and landing page testing. There are multiple reasons it can be used, but usually gets overlooked.
Kate Morris is the Director of Client Strategies at New Edge Media. You can find her on her blog or on twitter @katemorris.


