A wealth of SEO insights can be gleaned from analyzing Google Analytics.
Looking at Analytics on a consistent basis can help to identify not only performance issues but also optimization opportunities.
Check out six of these high-level, actionable insights that you can easily assess and apply to improve your organic strategy.
1. Custom Segments
Custom segments have been a key feature of Google Analytics for a while, allowing you to see traffic by channel, visitors who completed goals, demographic data, and much more.
Custom segments can be created from almost any facet of user data, including time on site, visits to specific pages, visitors who completed a goal, visitors from a specific location, and more.
Using segments helps you learn more about the users on your site and how they engage with it.
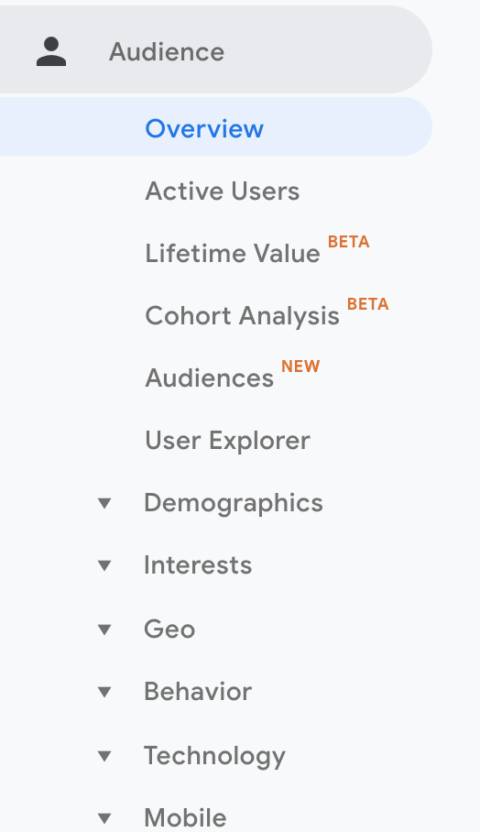
One insightful area to explore when determining additional segments to create is in the Audience tab of Google Analytics.
If you navigate to Audience > Interests > Overview, the Overview will display a high-level look at three interests reports:
- Affinity Categories.
- In-Market Segments.
- Other Categories.
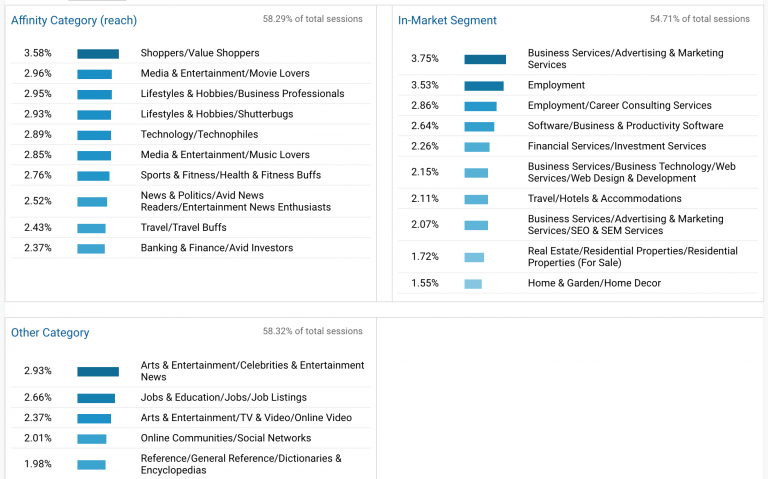
In the example below, you’ll see that almost 4% of visitors are Shoppers or Value Shoppers and almost 4% of users also work or have an interest in business marketing services.
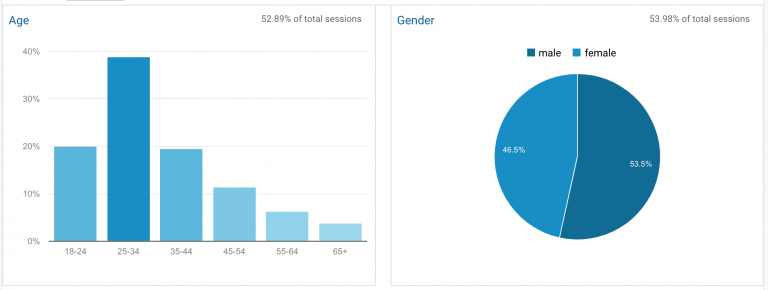
To dive deeper, navigate to Demographics under the Audience tab to view Age and Gender data.
The majority of visitors to this site are in the 25-34 age range and skew male by a slight margin.
Now, using this data, you can create a custom segment.
Return to Audience > Overview to view All Sessions.
Create a new segment by selecting +Add Segment so that we can monitor the behavior of users in this segment, the most frequent of visitors, compared to the rest of the visitors to the site.
Keep in mind that you will want to set a date range for at least 6 months to a year if possible, to have a good compilation of data.
2. Monitor Mobile Traffic
The importance of mobile traffic — and mobile web performance as a whole — cannot be stressed enough.
However, instead of simply monitoring mobile traffic to a site, it’s also important to monitor the engagement levels of mobile visitors.
You can do a few things to assess this:
- View the number of mobile conversions at the individual page level. Do this by adding a mobile segment.
- Monitor the mobile bounce rate. Be on the lookout for pages with high mobile bounce rates. This can help you hone in on potential issues related to a singular page.
- Compare mobile and desktop bounce rate metrics. Doing this for the same page can provide further insight into the differences between the mobile experience and desktop experience.
- Look at new versus returning mobile users. Doing this can help provide more information into how many users are finding your content for the first time, and who may be becoming a return visitor, customer, or client.
3. Focus on Site Search
Do you have a search bar on your website? If so, you have an enormous opportunity to learn about what visitors are looking for when they reach your site.
You can not only gain insight into what they are searching for but how many people are searching, as well.
For example, if a large percentage of your traffic is using the search bar, it is most likely a strong indication that the main navigation may need to be improved on the site in order to provide users with a clearer idea of the location of what they are searching for.
It is also important to test that site search is working. For example, when a user is searching for a term via site search, are results returned that span the entirety of the site?
If there are no relevant results, is the user guided to another portion of the website?
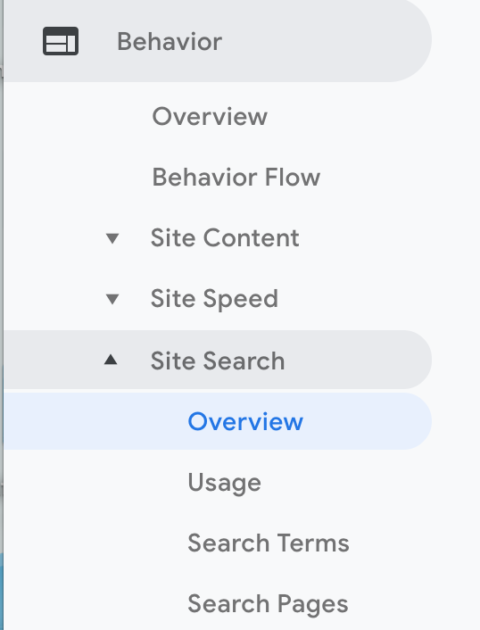
The actual search term that users are entering into the bar can also help to provide insight into content ideas.
For example, if a user is frequently searching for a term that a site does not have a great amount of content about, and it makes sense for the site to feature that content, it may mean that you could benefit and users could benefit from adding content about that topic to the website.
Or, if a user is searching for a particular product or service more frequently, perhaps that indicates that product or service should be featured more prominently on the homepage or more easily accessible on the whole.
4. Bounce Rate Can Give You Some Good Pointers
A website’s bounce rate is the percentage of people who visit your website and then leave after viewing only one page.
While some high bounce rates may not necessarily translate into a poor user experience (take sites with a lot of recipes for example), it may be indicative that visitors haven’t found what they were looking for on the site.
Say you rank highly for a very long-tail, niche term but when a person gets to the site, the content does not speak to that query and they then leave, or “bounce.”
Or alternatively, say a user reaches a site and the page takes a longer-than-average amount of time to load, and then the visitor chooses not to wait and they also move along.
A website’s page speed performance, design, and poor UI/UX are also usually culprits for a high bounce rate.
Adjust the time frame in Google Analytics and assess your bounce rate quarter-over-quarter to determine if it has either increased or decreased.
If it has increased significantly, it may be a sign that something on the site needs updating.
5. Locate Top Performing Pages by Conversions
Understanding individual page performance and conversions that took place on each page can help provide enormous amounts of insight.
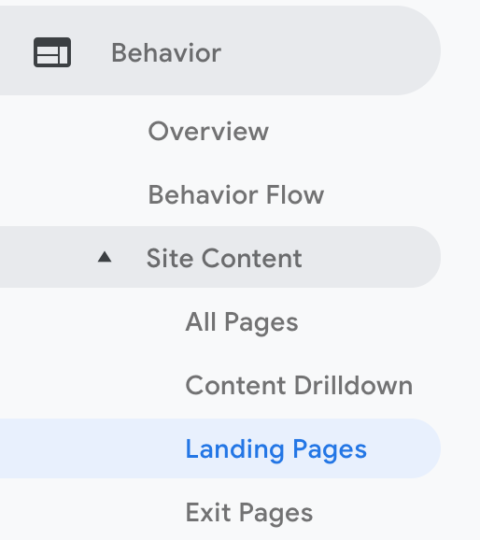
Navigate to Behavior > Site Content > Landing Pages and adjust the time periods to compare quarter-over-quarter or year-over-year.
Watch for negative trends on each individual page. If a specific page has seen a noticeable decline, the issue is most likely isolated to that one page.
However, if there is a negative decrease across several pages, it may be a sign that there are some more technical issues to work through.

6. Locate Underperforming Pages
Pages don’t always perform well and may lose traffic and organic visibility over time. By using Google Analytics, you can also tie in conversion data with these metrics to see which pages could especially benefit from a re-write or another sort of update.
Navigate to Acquisition > Search Console > Landing Pages, and then select a specific time period to compare.
Try to stick to a minimum 6-month time frame so there is enough historical data to assess.
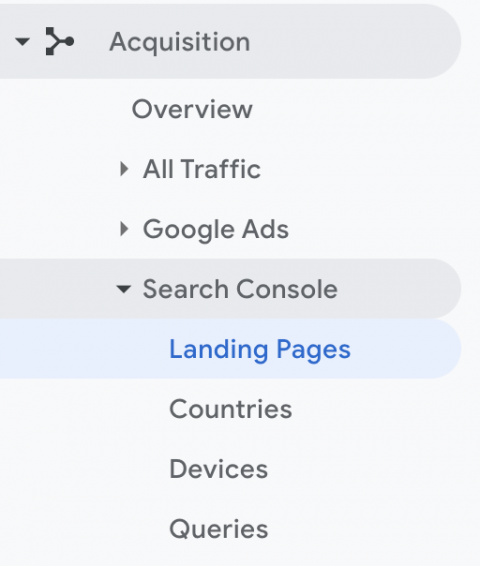
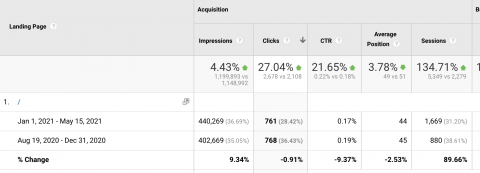
Next, sort the table by clicks and determine which page you want to dive into further to see search query data.
Let’s say a page is receiving a decent amount of clicks but has a very low click-through rate (CTR). This could be indicative that it’s time for a refresh.
Conclusion
These are just a few of the opportunities you can tap into in Google Analytics.
Using this free tool to its full potential can help drive very valuable marketing insights that can help formulate stronger SEO strategies.
More Resources:
- 6 Ways to Use Google Analytics You Haven’t Thought Of
- How to Set up Google Analytics Goals & 7 Tips to Get Ahead
- Core Web Vitals: A Complete Guide
Image Credits
All screenshots taken by author, May 2021


