Being chosen as the source of a Featured Snippets or “Quick Answers” is an alluring goal for many search engine marketers. Executives seem to love them, and quick answers give sites the opportunity to cover more real estate on a search engine results page (SERP).
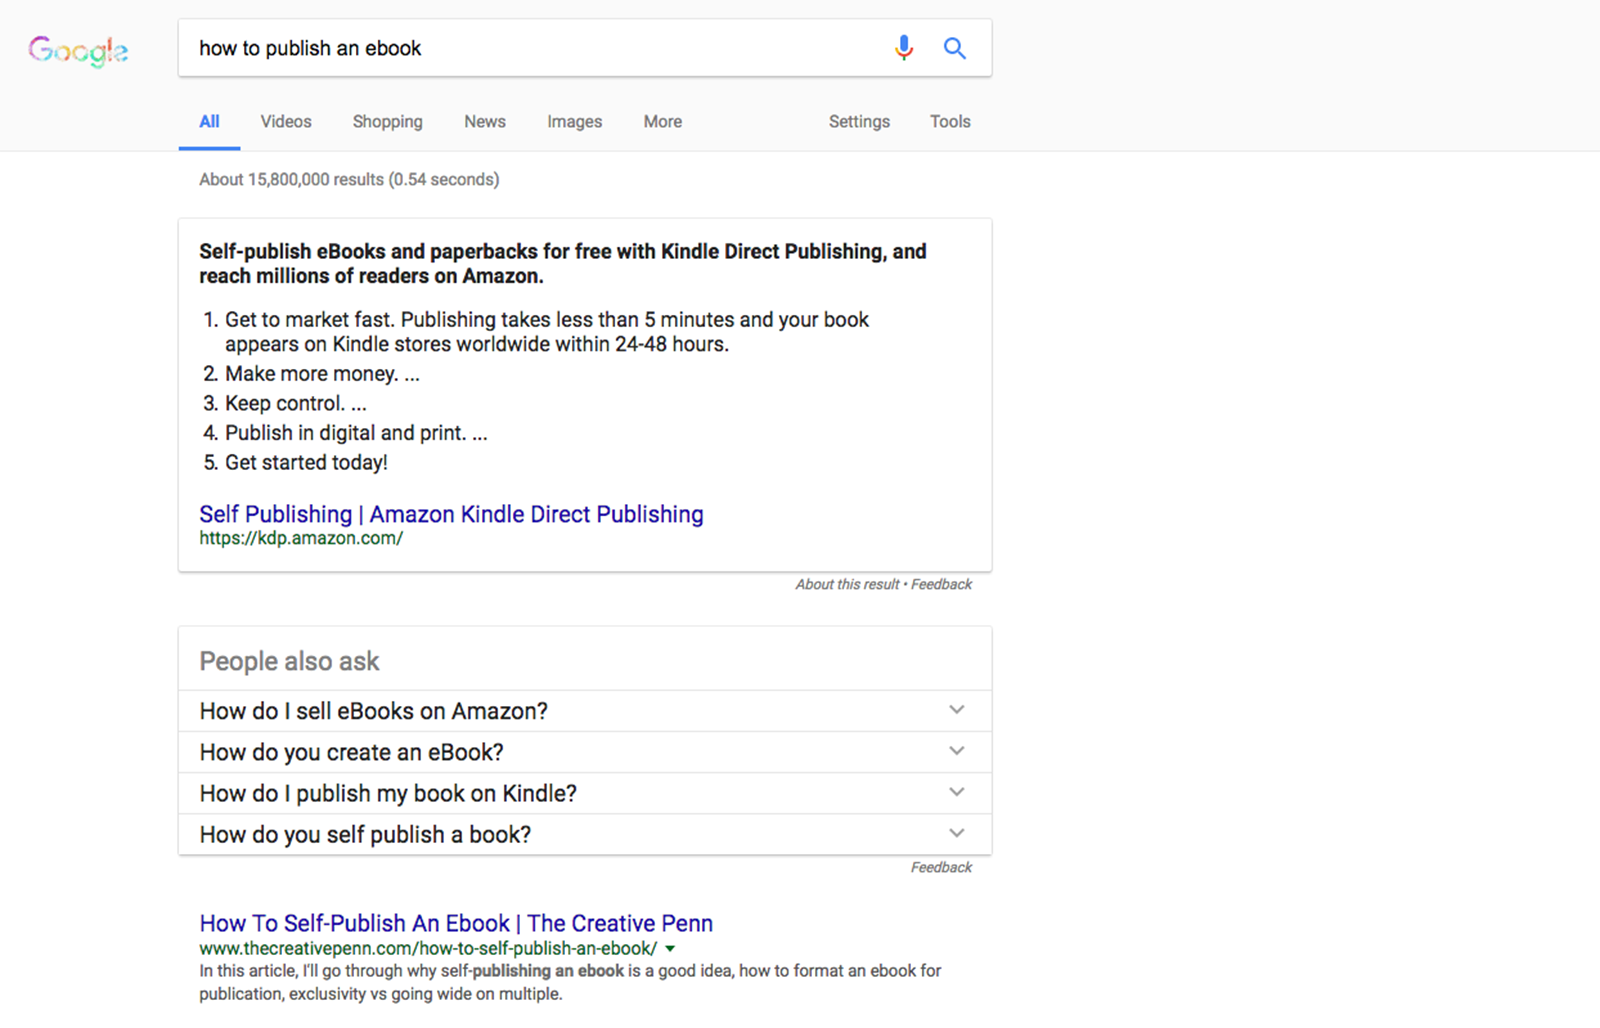
As a marketing community, we are doing our best to unveil the secrets of this algorithm (primarily RankBrain), or at least understand some of the logic behind it. Google tells us there is no way to optimize for RankBrain.
Even so, maybe there are patterns we should be looking at.
I decided to launch a project to focus directly on the e-commerce industry. I developed a list of the top 20 sites many of us can’t live without. (Is there an Amazon addict support group?) Over the course of five months, I analyzed over 280,000 keywords.
It seemed like many articles advised that to get a quick answer, you just had to write a how-to article and rank on page one of the SERP.
But is that it?
Hypothesis
Over time, branded content as well as “how-to” and “what is” answers would grow and dominate the quick answers box.
I soon realized that thinking was too narrow — this system is drastically more complex and evolving, and needed to look at how the data trended over time and look for additional patterns.
Source
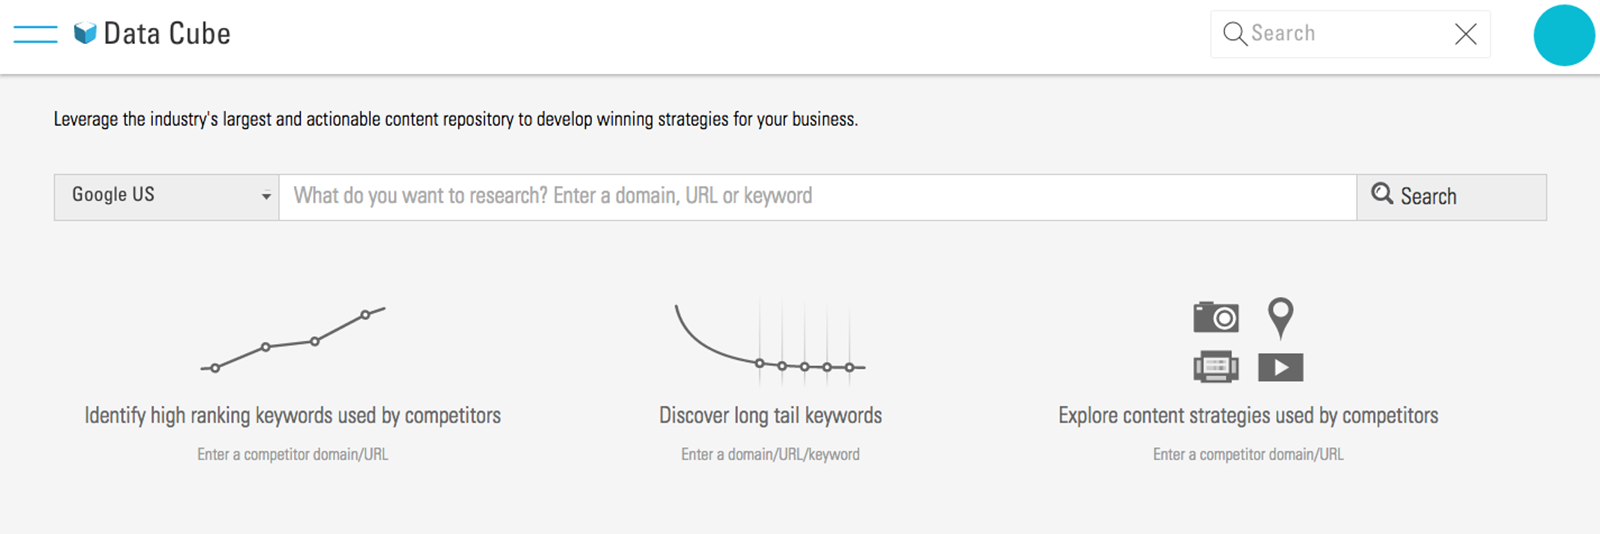
- Source: BrightEdge Data Cube (latest data set: January 17, 2017)
- Collection duration: Five months (September 2016 through January 2017)
- Volume of keywords: 282,000
BrightEdge is an enterprise keyword crawling software that has a great user experience and pulls in massive amounts of data across the entire web.
Top E-Commerce Sites
I examined several lists across the internet that showcased top revenue-driving e-commerce sites. My list includes these top e-commerce sites:
- Amazon
- Best Buy
- Ebay
- Etsy
- B&H Photo Video
- Grainger
- Newegg
- Overstock
- Wayfair
- Home Depot
- Ikea
- Lowes
- Office Depot
- REI
- Staples
- Sears
- Target
- Walgreens
- Walmart
Process
First, I developed a monthly template for my analysis (template developed).
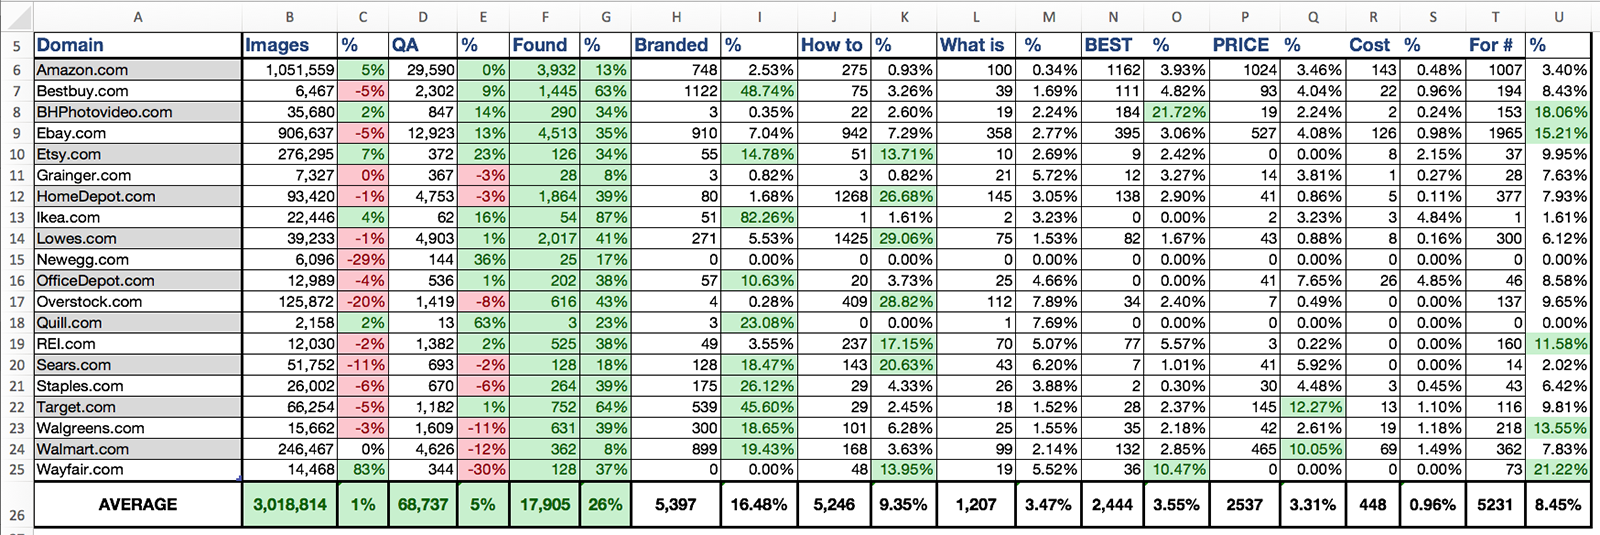
Then I manually pulled keywords (along with their page and search volume) that registered a quick answer from BrightEdge Data Cube.
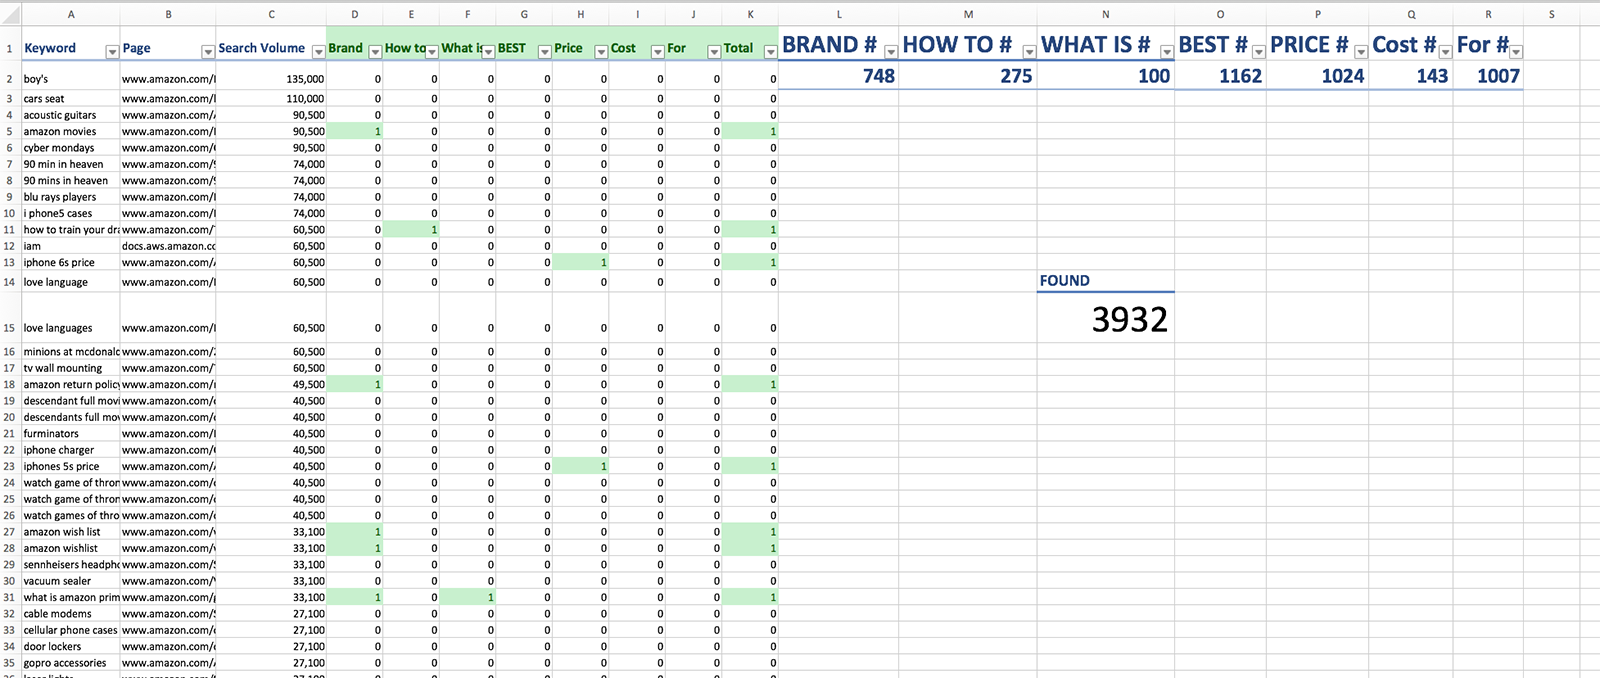
Initially used columns for each type of quick answer I wanted to research:
- Keywords that contained the brand name (e.g., “Amazon Return Policy”)
- What is (e.g., “What is Amazon Prime?”)
- How to (e.g., “How to cancel Amazon Prime?”)
To identify if a keyword belonged in any of the three categories above, I developed a formula:
=IF((SUMPRODUCT(–ISNUMBER(SEARCH({“how to “},A2)))>0)=TRUE,1,0)
I realized that the percentage of discovered patterns compared to the total was too small and that I needed to find more, so I began filtering out all identified patterns and searched manually. This led to the discovery of “best,” “price,” “cost,” and “for,” and added columns for each of the newly identified patterns to further analyze them.
This was followed by a calculation of the number of identified patterns, and I ensured that no keyword would be counted more than once if it fell into multiple patterns. For example, “What is Amazon Prime” contains two: “What is” and the brand name.
At one point, I tried to use Excel to figure out more patterns but that failed, so I resorted to searching manually. If anyone has thoughts on how to use Excel for this, please let me know.
Noteworthy Findings
The winners within each category were as follows:
- “How to”
- Lowes: >1,400
- Home Depot: >1,200
- eBay: >1,000
- “What is”: eBay at >300
- “Best”: Amazon at >1,100
- “Price”
- This is arguably the most valuable category for e-commerce sites
- Amazon: >1,000
- Walmart: >450
- “Cost”: Amazon at >100
- “For”
- Expected Lowes or Home Depot to be highest, but was wrong
- eBay: >1,900
- Amazon: >1,000
Other Interesting Findings
- Largest drop in results month over month: Etsy
- Largest bucket across the board, excluding unclassified: “How to”
- Branded query winners
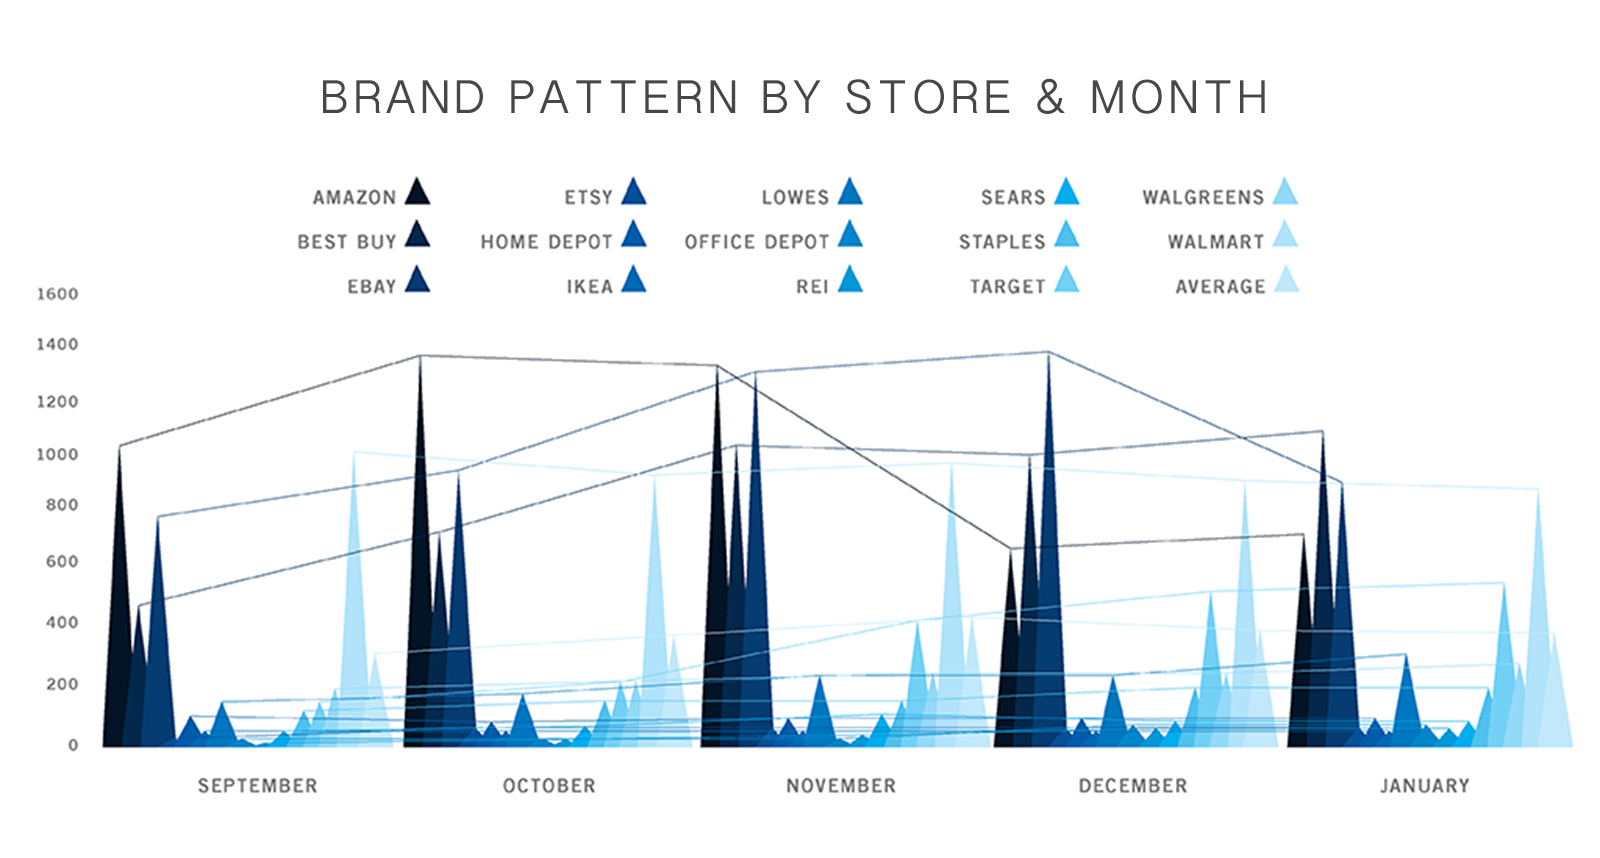
- Best Buy: 1,100+
- eBay: 900+
- Walmart: 900
- Amazon had a 27% decline during the period
- Biggest winners over time by percentage
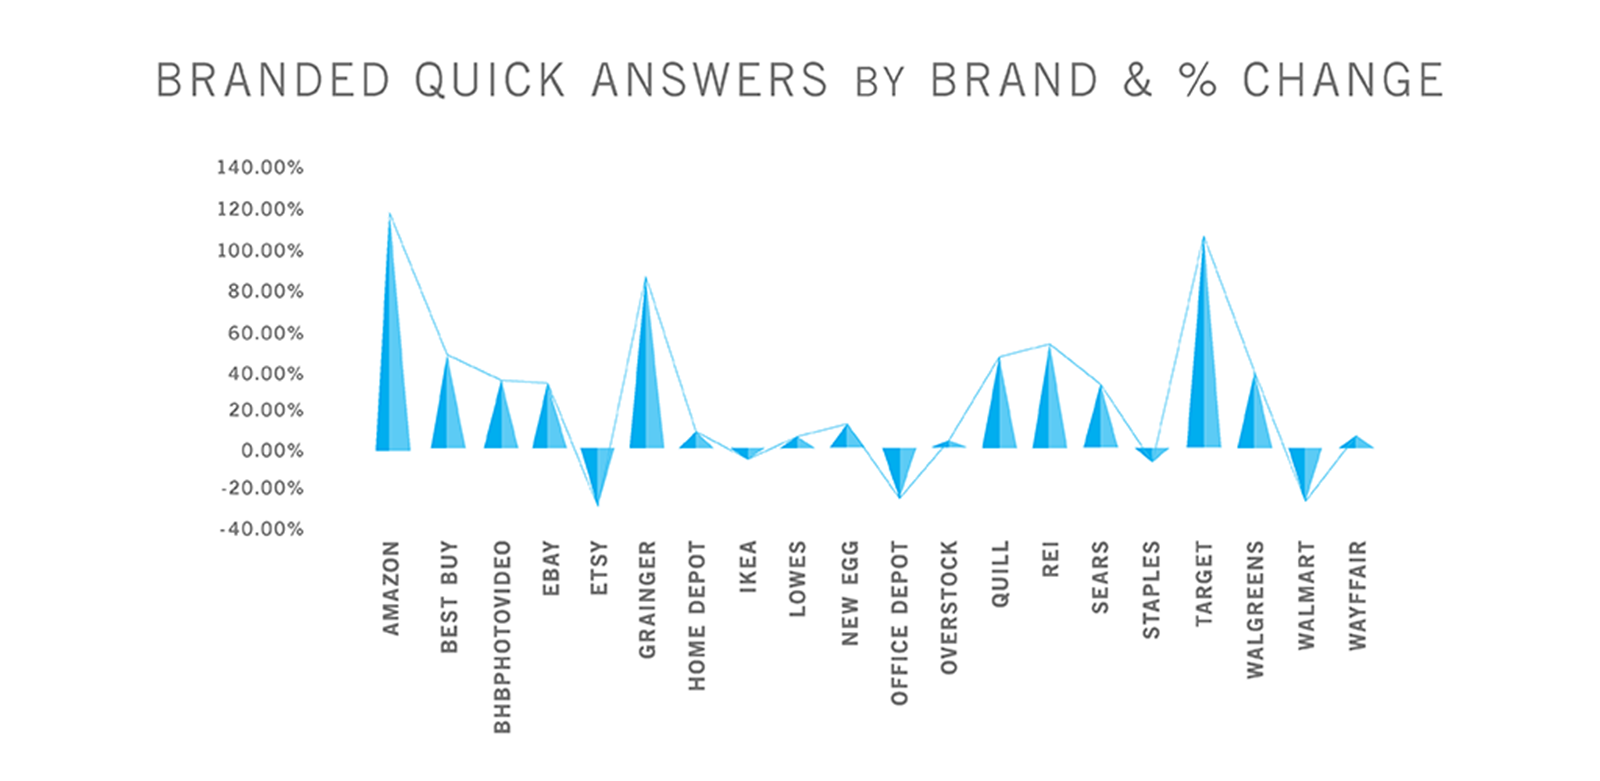
- Amazon: 115%
- Target: 104%
- Grainger: 82%
- Phrases on the rise
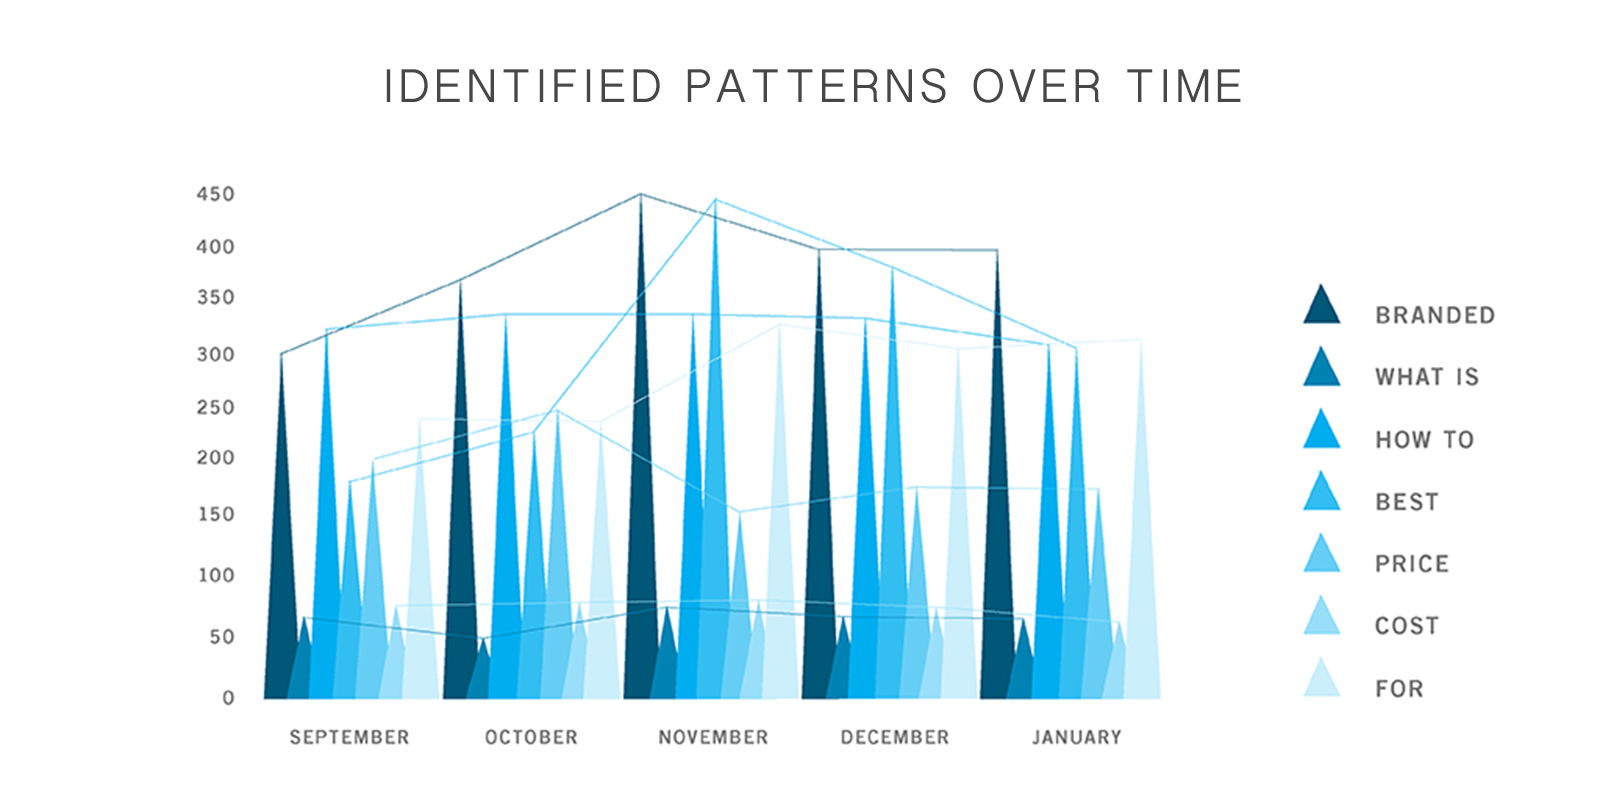
- “Best”: 58%
- Branded: 28%
- “For”: 27%
Conclusion
In the last five months, the number of quick answers, on average, has risen by over 26%, and we should see a further rise in the coming months. At the same time, Amazon alone has seen a 113% jump from January 2016 to 2017.
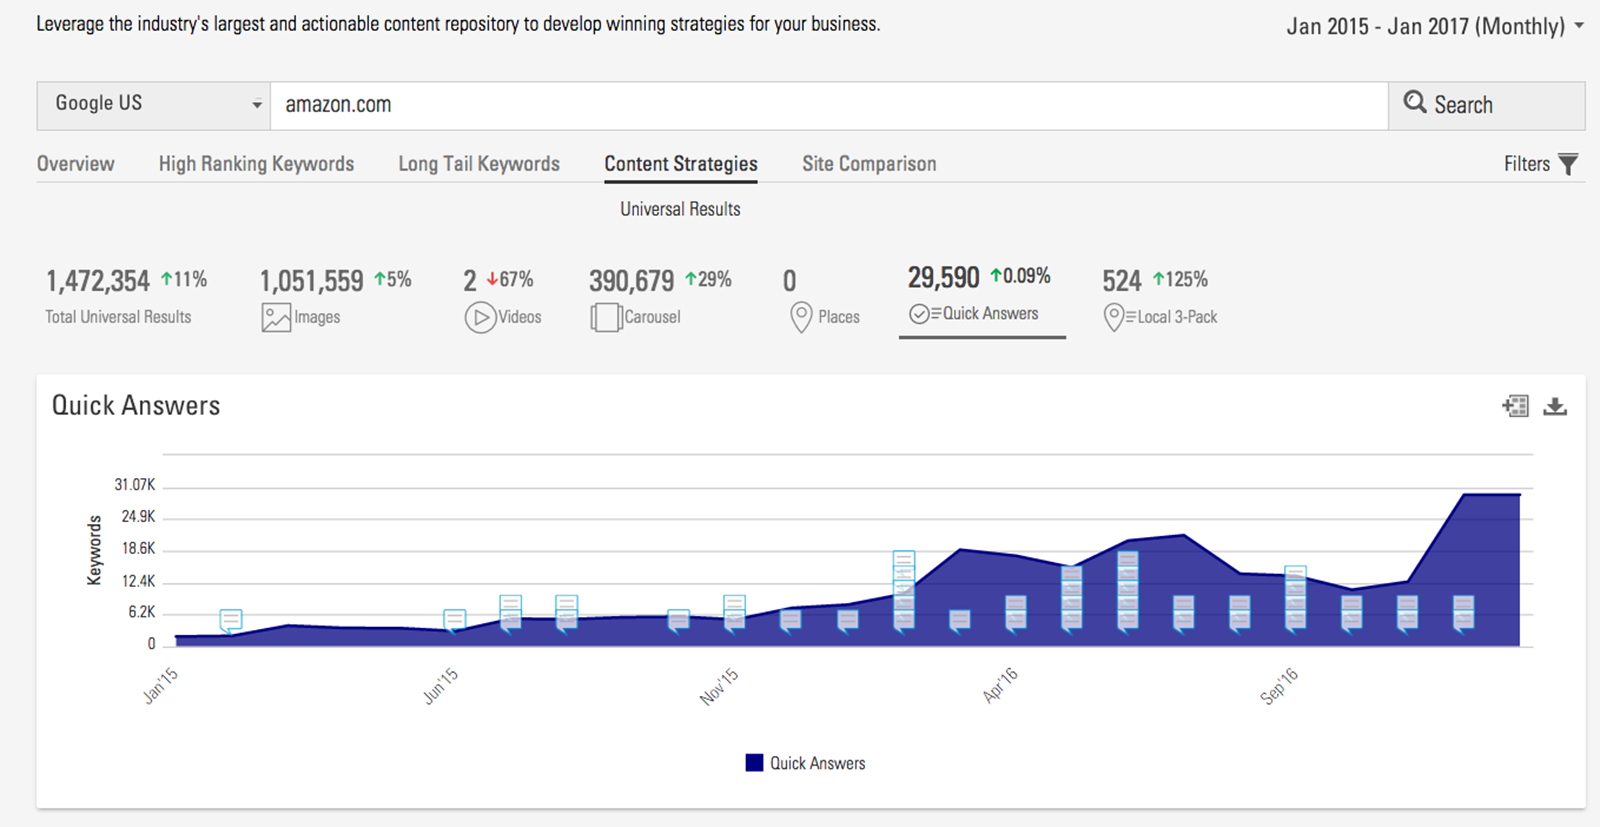
However, at some point this year it should start to level off. That number may decrease, as some of the results don’t seem to warrant a quick answer.
Initially, I thought the seven patterns analyzed would suffice a majority of the findings, but that encompassed only 32% of the total keywords analyzed in this project. I even tested the patterns researched by A.J. Ghergich, but they did not seem to result in any substantial discovery in this set of websites.
I had theorized that a quick answer box would appear primarily for a question, but many came up that had nothing to do with one. Instead, they appeared on a query for a product. It almost seems as if certain sites were able to jump to the front of the line by simply using that magic format for their content, which may prove to be an opportunity for your own content.
I also recently read A.J. Ghergich’s thorough featured snippet article that provides analysis across the entire gamut of search terms and websites. It breaks down the ideal format to land a featured snippet, as well as uncovers more patterns beyond the scope of this analysis.
You can find a summary of all data here (please message for detailed data collection).
Synopsis
- Quick answers are on the rise and still have room for growth as well as refinement (recent examples [1] [2] [3] of inaccurate data indicate that).
- Questions are not the only queries that will result in a quick answer.
- Look at your content formatting/templates to score a quick win.
- The types of queries that result in a quick answer will become more complex, especially with the rise of voice search and utilization of RankBrain.
Your Thoughts
What do you think of this analysis? Is your company seeing the same results? Please reach out to me. I would love to collaborate on my next release!
Image Credits
Featured Image by Eugene Feygin. Taken November 2014.
Screenshots by Eugene Feygin. Taken March 2017.
Graphs by Eugene Feygin. Created March 2017.

![An Analysis of Google’s “Featured Snippets” and 280k E-Commerce Keywords [STUDY]](https://www.searchenginejournal.com/wp-content/uploads/2017/03/Quick-Answer-Analysis.png)


![[SEO, PPC & Attribution] Unlocking The Power Of Offline Marketing In A Digital World](https://www.searchenginejournal.com/wp-content/uploads/2025/03/sidebar1x-534.png)