After auditing hundreds of Google Ads accounts over the years, I often see sneaky areas that can be a goldmine for tightening up results.
An account audit often helps find where some revenue might be escaping.
It can also reveal some costs that might be sneaking right by and impacting the bottom line.
There are a million ways to audit an account and there are some really specific things you can dig into to find where you might be leaking cash.
Here are some of my go-to ways to check in on myself as a manager from time to time.
1. Location Performance
If you launched your campaign with the default setting for location targeting, it is easy to forget about it if performance is strong.
The campaign default for Location targeting has always been a little sneaky, hidden under the Location options dropdown.
Here’s what it looks like:
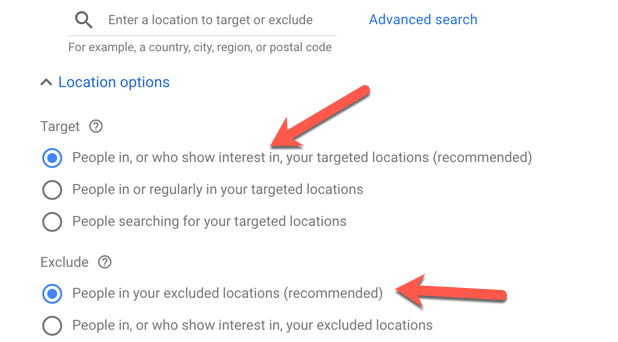
Notice that this setting gives Google permission to show your ads outside of your core targeted area.
Additional users are those who show interest in your targeted area.
They see your ads because of terms used in their searches, or because they view content related to the targeted location.
In other words, they aren’t in the location you’re actually targeting!
To see how these two very different audience types perform, go to the Reports area and then the User Location option.
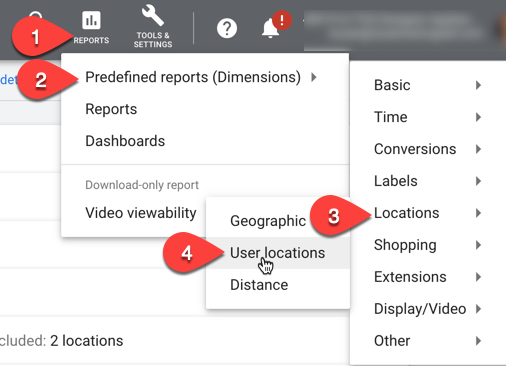
It will list a whole lot of columns showing user location from country down to city.
You can remove all those, and drop in a column for Location type.
This will break apart the targeting between users physically in your target areas versus those who have an interest in your targeted locations.

Evaluate what these two audience types do for you. Sometimes the results are horrible, and sometimes they’re great.
In this case, the Location of interest performs well for this client.
Why?
Because they target the New York City suburbs.
Historically, many of their targeted audience commute out of those suburbs every day into the city.
Instances like these with densely populated areas and users that move around a lot can really benefit from the Location of interest setting.
In other account types, this can perform terribly.
Changing your Advanced Location Targeting Settings to people only in your target location can keep your ads only showing to those audiences who actually convert.
This is if you decide the difference in CPA or ROAS isn’t worth the extra volume it provides.
Likewise, pulling performance by User Location can help you easily spot which geographies might be driving up your CPA or ROAS (strategies for situations like this are covered in Tip #4).
2. Query Matching
I’m a self-admitted control freak about how search queries match to my campaigns.
Some will always slip through, but it is easier to miss queries consistently matching to the wrong ad group when you’re just looking through the Search Query Report.
I’ve found it far more beneficial to pull the data into Excel and create a quick pivot table. This instantly makes matching issues evident visually.
The first thing you want to do is view your search queries.
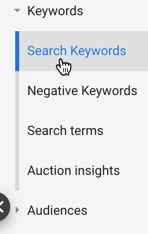
I typically do this at the Account level. I also make sure to have columns for Campaign and Ad Group in there so I can work with them in the pivot table.
Download your terms and open the .csv in Excel.
You will have a long sheet with rows of search queries, and columns denoting Campaign and Ad Group.
You’ll be able to see duplicate search queries, which is why this report is so helpful.
A search query that is matching to a bunch of different ad groups can be really hard to see or figure out in the Search Query Report view within Google Ads.
Create a pivot table off these rows of data instead.
For the fields, simply choose “Search Terms” for the Rows, and then for values choose “Ad Group,” which should be left as “Count.”
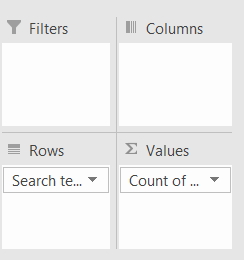
Once you do this, you will have a table that looks like this:
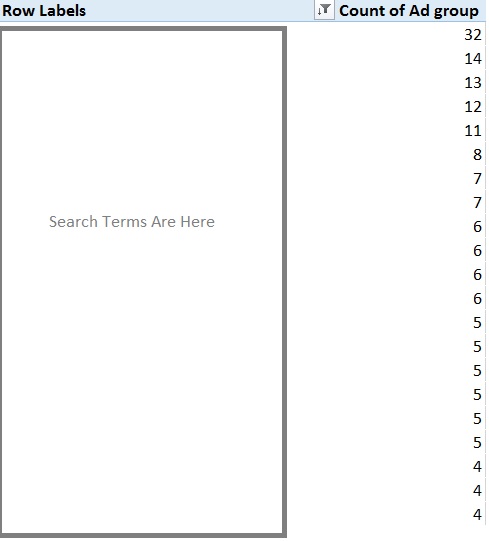
This immediately shows the search terms and how many ad groups they are matching to, so it’s evident quickly if there are any issues.
For example, that first search query is being matched to 32 different ad groups – yikes!
In this particular instance, it’s account structure that is replicated among many geographies, so there are many identically-named Ad Groups.
I would expect it to be matched multiple times, but certainly not this many – just something to take note of when you see a term matching to more than one place.
To make short work of zeroing in on where it’s matching to multiple places within each Campaign, tweak the pivot table a little.
Zeroing-In on Matching Offenders
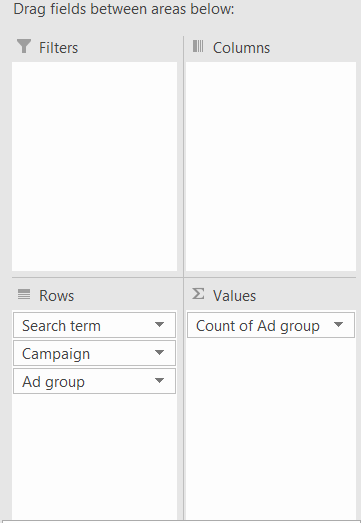
Drop “Campaign” and then “Ad Group” into the Rows field, underneath the already-existing Search Term area.
Make sure you also keep the count of Ad Group in the Values field.
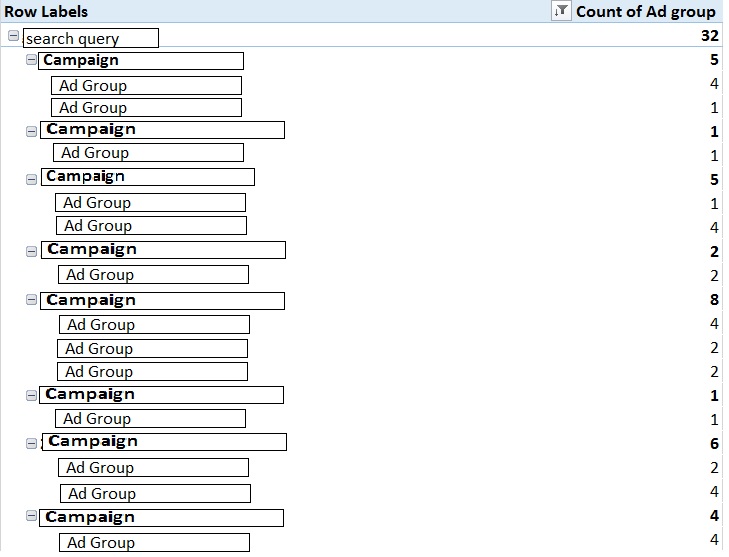
You can then sort by Ad Group Count from highest to lowest and have a road map for that one query that’s matching, easily spotting the Campaign and Ad Group locations.
This is how it renders when I do this for the search query that was matched in 32 places.
I now know exactly where to add it as a negative:
3. Check for Competition Changes
It’s easy to get wrapped up in your own performance and forget that things might be changing in the auction itself, as well.
One way to keep tabs on competitors, and any of their moves, is by using the Auction Insights tool.
It shows who you’re competing with and it allows you to see how you stack up against them.
You’re also able to see what your impression share is like versus theirs and segment it by time or device.
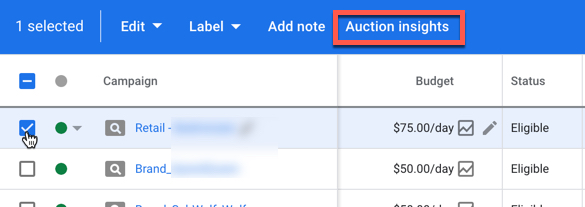
Auction Insights becomes an option after you tick the checkbox next to the Campaign or Ad Group you want to analyze.
A blue bar appears at the top with the option:
It will populate with some initially interesting information:
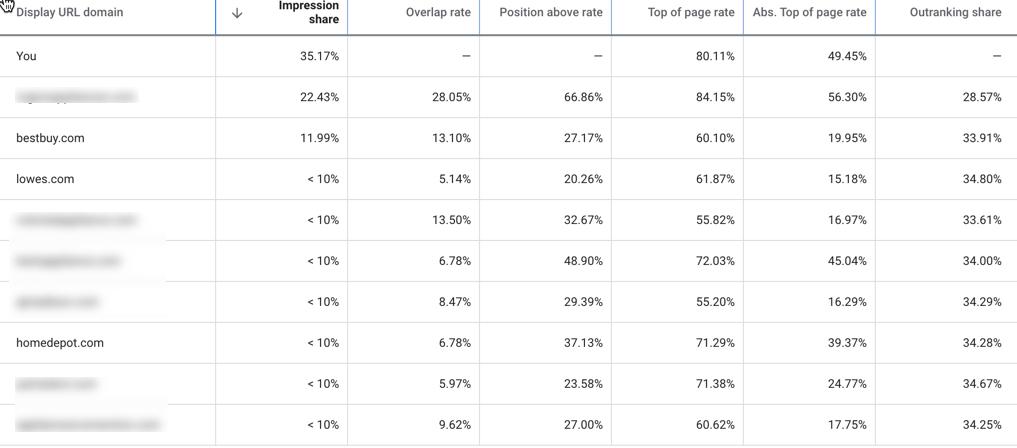
While interesting, it isn’t particularly actionable.
There are a few field options you can add, however, that help this data become something a lot more useful.
Auction Insights Mobile Segmentation
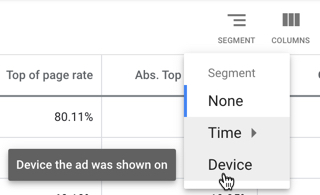
This will further segment the data you saw by device type:
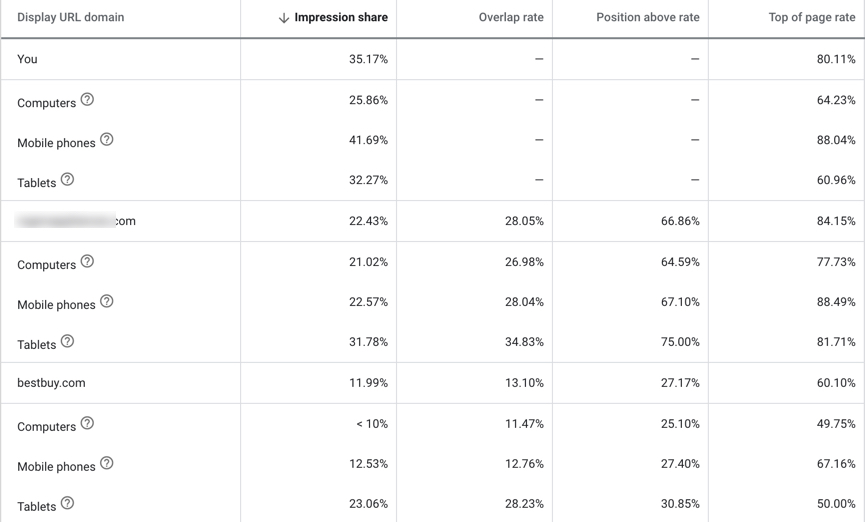
From here, you can see your own stats and how they compare with your competition, specifically with regards to mobile.
It also gives you insight as to who you’re competing with more so in mobile vs. desktop.
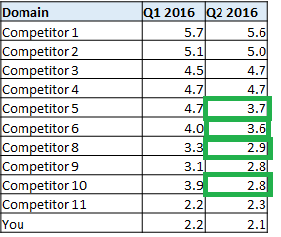
Competition Over Time Segmentation
Using the segmentation we did for Device, you can go back to that same area and choose “Time.”
Checking on this quarterly can give valuable insights.
It gives insight to:
- Who might be spending more.
- Who has made obvious account improvements.
- Who you might need to keep an eye on closer than you did before.
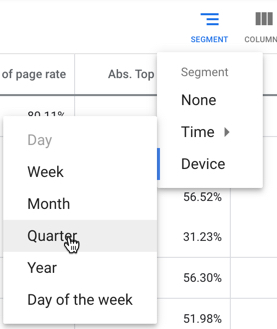
Once you export the data, you can create a quick pivot table in Excel to help you get insights faster
4. Account Structure Possibilities
This one requires that you really take a fresh look at where your account is from a structural standpoint to evaluate if it’s time to change it.
This has less cut and dry steps because so much of it depends on the business type of the account, the performance, and any limitations that might exist.
These are some questions that can help you evaluate if your structure is still on point:
Do the Campaigns Contain Tons of Ad Groups?
If so, does performance really just come from a handful of them that would benefit from being their own campaign(s)?
Is there more that could be spent but budget caps are preventing it?
If this is the case, you may want to consider promoting the Ad Groups to their own campaign so you can allocate as much budget as possible to them.
Do You Need to Start Breaking Out Some Exact Match Keywords Into Their Own Ad Groups?
This realization can come from using the match type data you pulled in Tip #1 above.
Be on the lookout for high-converting terms that may not be getting everything they should be because of mixed match types, or multiple matching situations.
Is Geography Playing a Part?
Bid modifiers will only get you so far, and eventually, you may need greater control.
Look for geos sucking your budget dry that need to be capped, or vice versa.
Consider grouping geos together into campaigns or even isolating some on their own, if needed.
Auditing Google Ads Accounts: The Takeaway
Every account has its own challenges and quirks, and it’s easy to become blind over time to new opportunities.
Taking a fresh look at the data and performance outside of your regular routine is good practice.
It will help you uncover areas where performance could be improved further, and new ideas for moving the account forward can be tested.
More Resources:
- PPC 101: A Complete Guide to PPC Marketing Basics
- How to Conduct a Complete Google Ads Audit
- 8 Simple Google Ads Tips That Will Make You More Money
Image Credits
All screenshots taken by author, August 2020



![AI Overviews: We Reverse-Engineered Them So You Don't Have To [+ What You Need To Do Next]](https://www.searchenginejournal.com/wp-content/uploads/2025/04/sidebar1x-455.png)