Data blending in Looker Studio (formerly Google Data Studio) is a powerful technique that allows you to combine data from multiple sources in a single report or visualization.
You can create custom charts and reports that provide a comprehensive view of your data, bringing together insights from multiple data sources.
This technique can be particularly useful for SEO pros and digital marketers when you need to compare data from different sources.
How SEO Experts Can Use Data Blending
Since Google Search Console (GSC) and Google Analytics (GA) are different data platforms, you can’t see the social media traffic to articles and average position at the same time.
It can be particularly important to analyze if there is a correlation between social popularity and ranking position in search. With Looker Studio building, you can now build such correlation reports.
Blending data on website traffic, bounce rate, and time on site with keyword ranking data can help SEO pros gain a better understanding of how website performance affects search engine rankings.
How PPC Marketers Can Use Data Blending
PPC marketers can compare data across multiple ad platforms such as Google Ads, Facebook Ads, and LinkedIn Ads.
By blending data from these platforms, marketers can compare metrics such as cost per click (CPC), conversion rates, and ROI to identify which platform is performing best.
Also, they can combine data from multiple campaigns, allowing them to gain a more holistic view of their overall campaign performance and identify patterns or trends that may not be visible in individual campaigns.
Now let’s dive and learn with use case examples.
How To Blend Google Analytics 4 And Google Search Console Data
We will build a blended data source to find out if social media traffic and Google Discover visibility are correlating.
This will be an interesting experiment, especially given Gary Illyes recently said that social media may play an important role in improving indexability.
To blend data from two sources in Looker Studio, we’ll need to add both sources to our project.
If you haven’t already added the sources, let’s learn how to do that step-by-step. If you already know how to do this, you can skip and continue below.
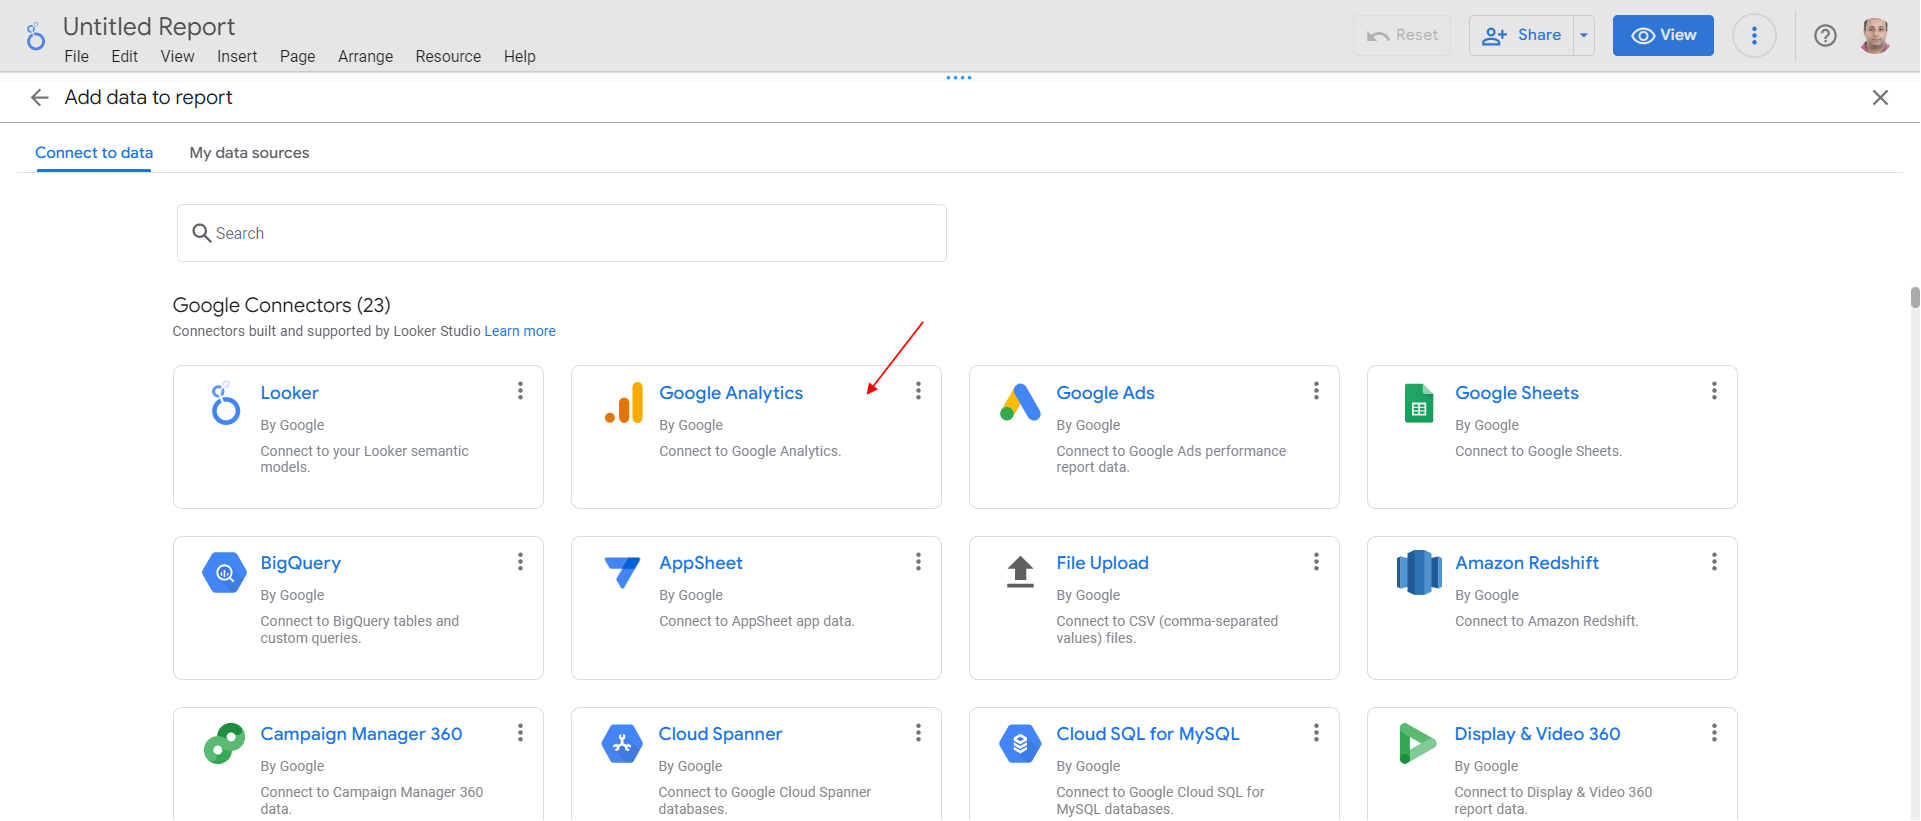
How To Add Google Analytics 4 Into Looker Studio
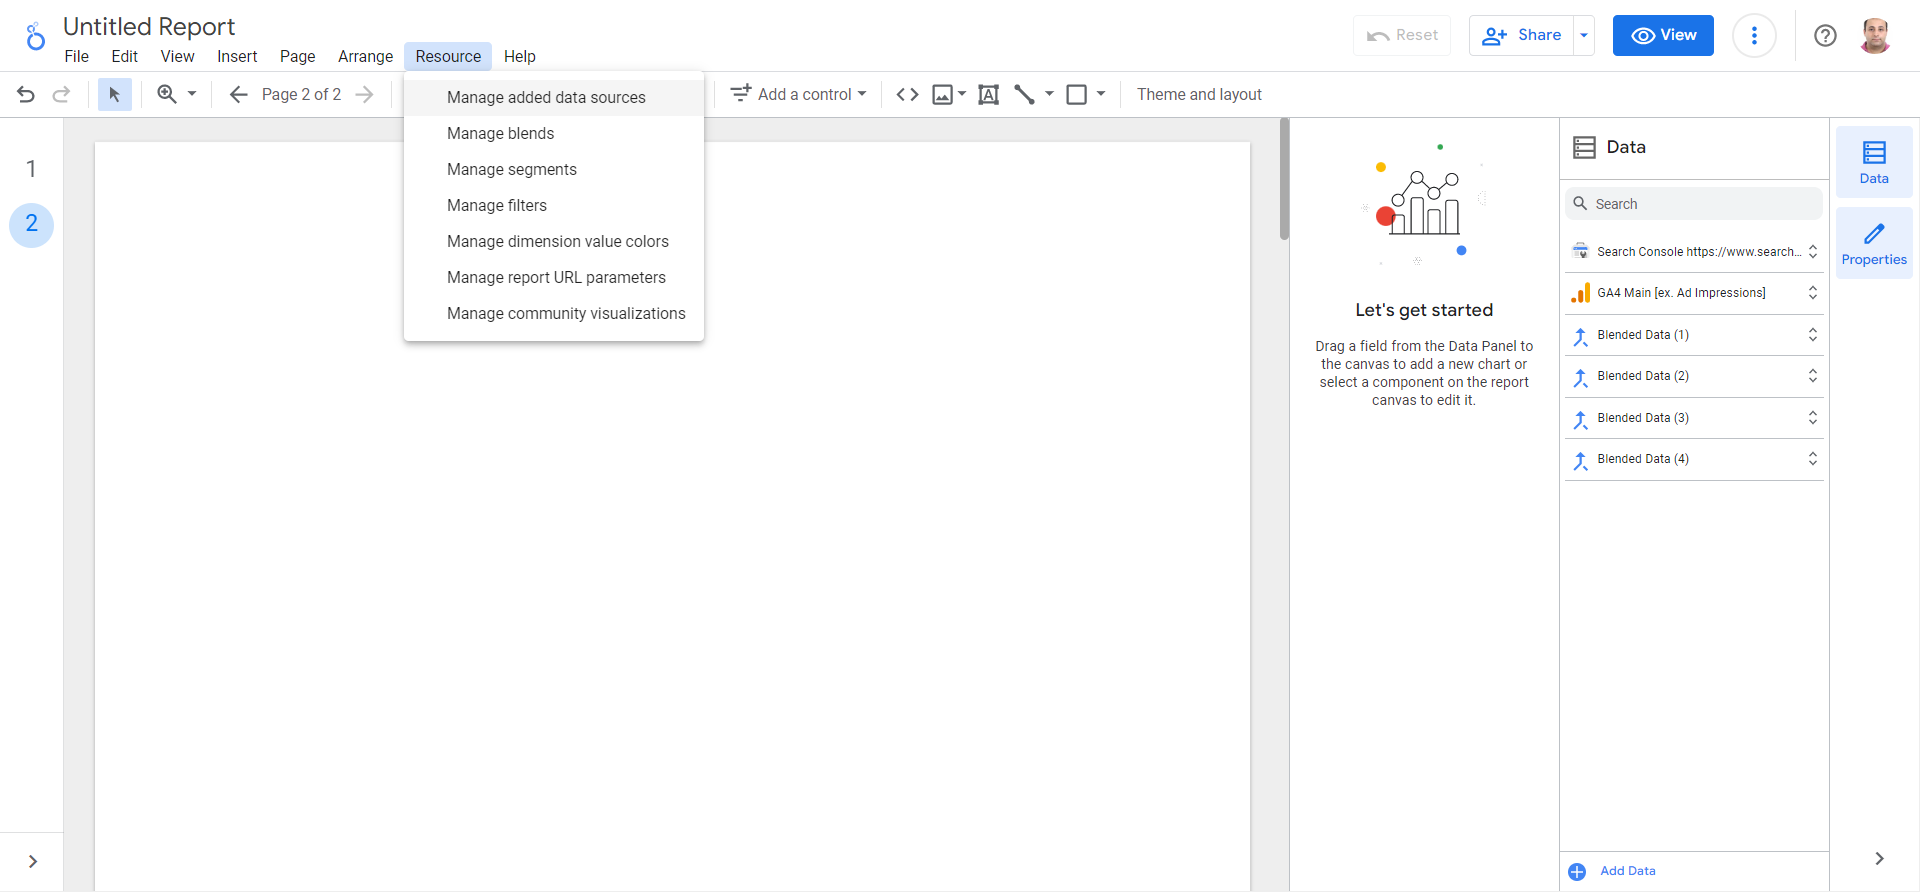
Go to Resources > Manage added data sources.
-
 Screenshot from GA4, May 2023
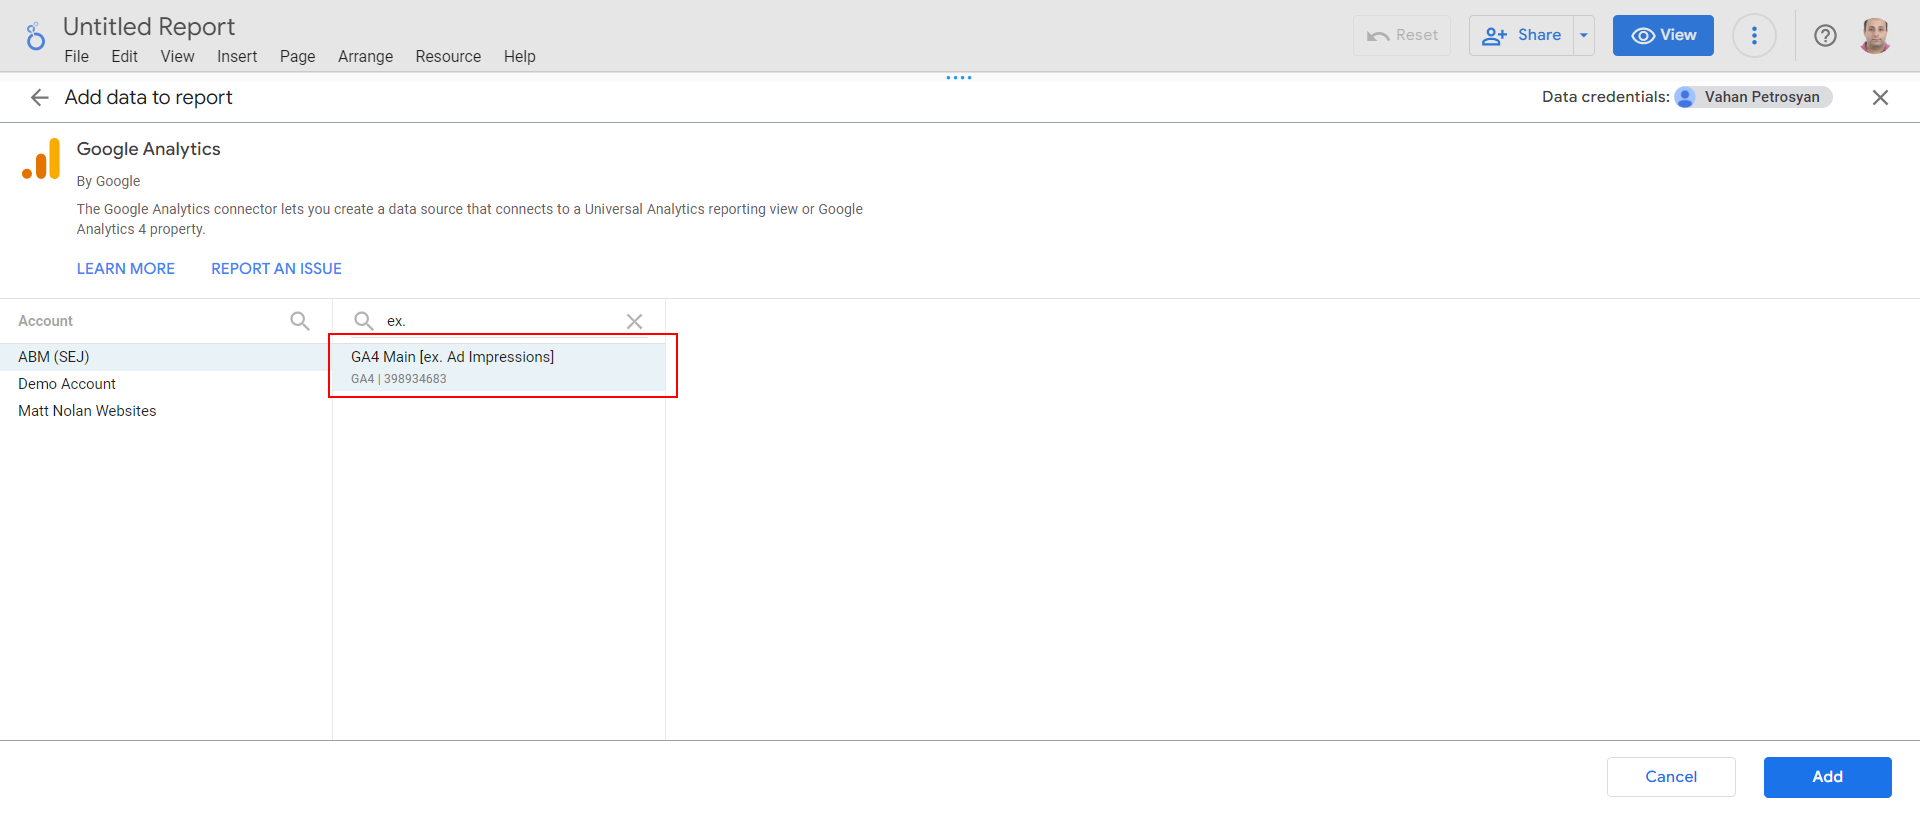
In the popup dialog, click the Add data source hyperlink and choose your Google Analytics 4 (GA4) property.
How To Add Search Console Data Into Looker Studio
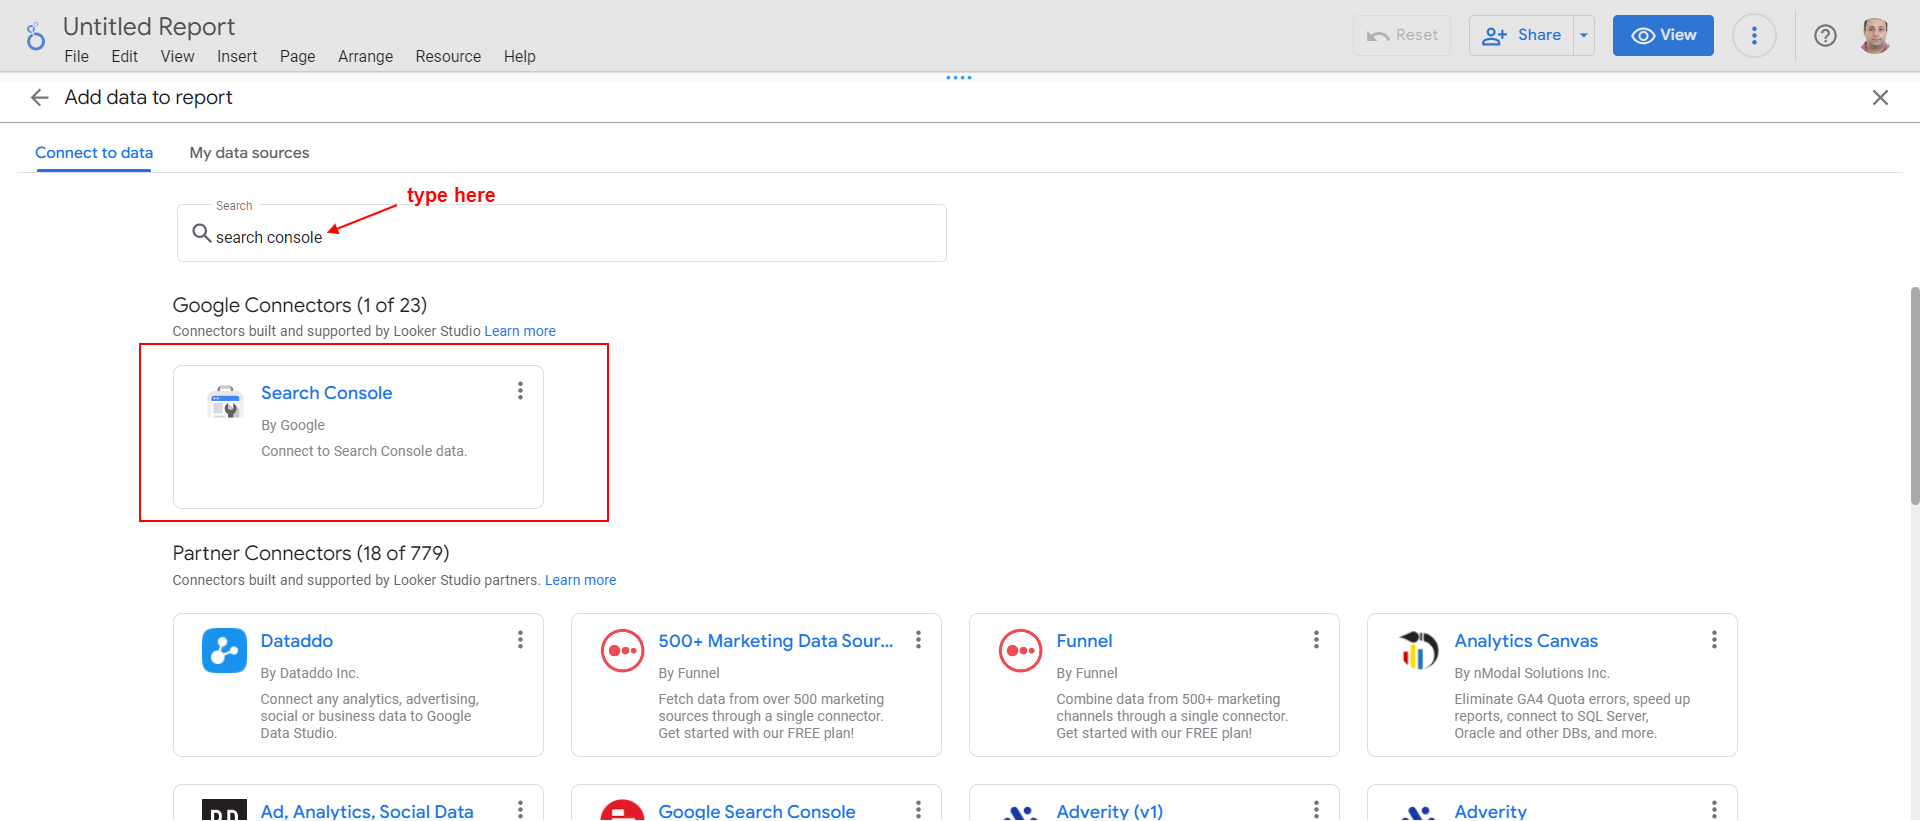
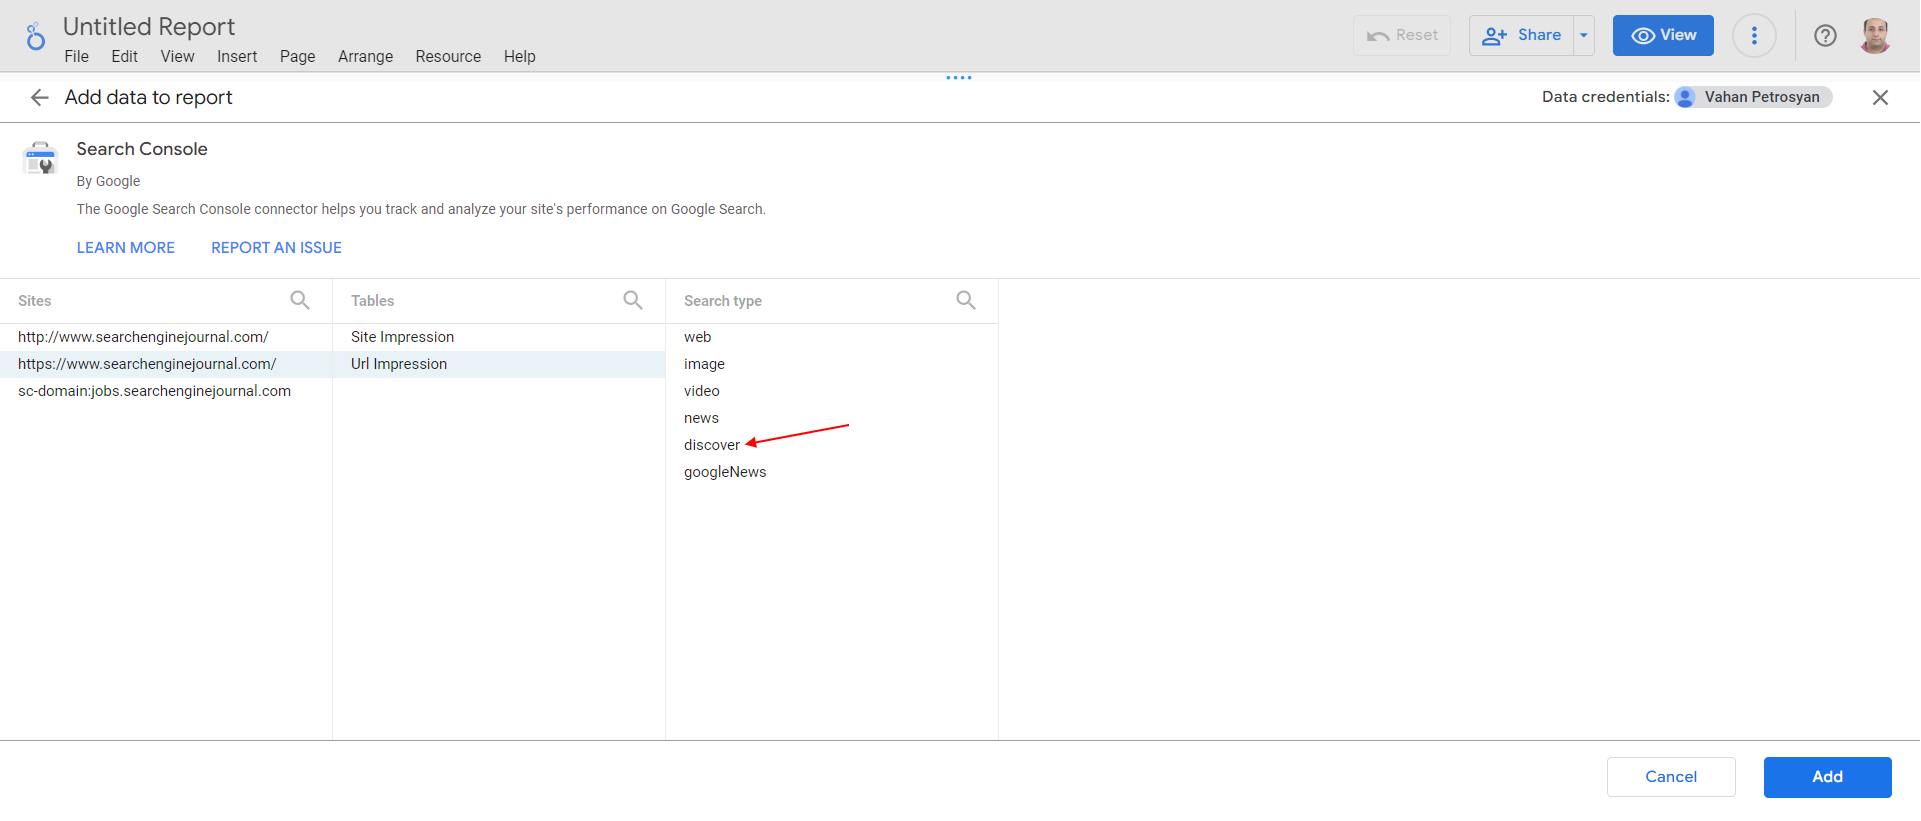
Go to Resources > Manage added data sources as in the previous step and search for “search console” in the popup dialog to find a connector.
-
 Screenshot from Looker Studio, May 2023
Select URL impressions > Discover to add Google Discover data into Looker Studio.
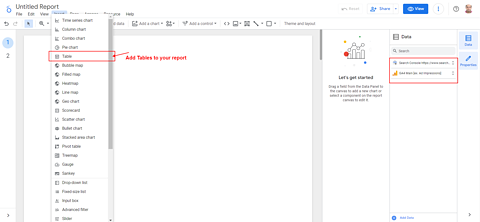
Now, let’s add data tables to our dashboard from each source.
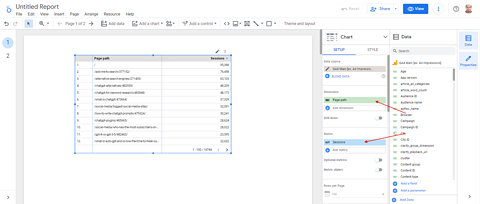
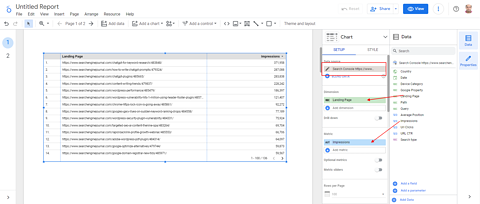
After all these steps, you will see data from each source, but you will notice that GSC has a full URL, whereas the GA4 table has only the path.
We should bring both data into the same format and set the same ID for the dimension field to be able to blend them.
It’s important to ensure that the IDs (or Names) and types of the fields you want to blend are consistent across all data sources.
(Looker Studio does also match by field name, but I highly recommend using the same Fields IDs, too.)
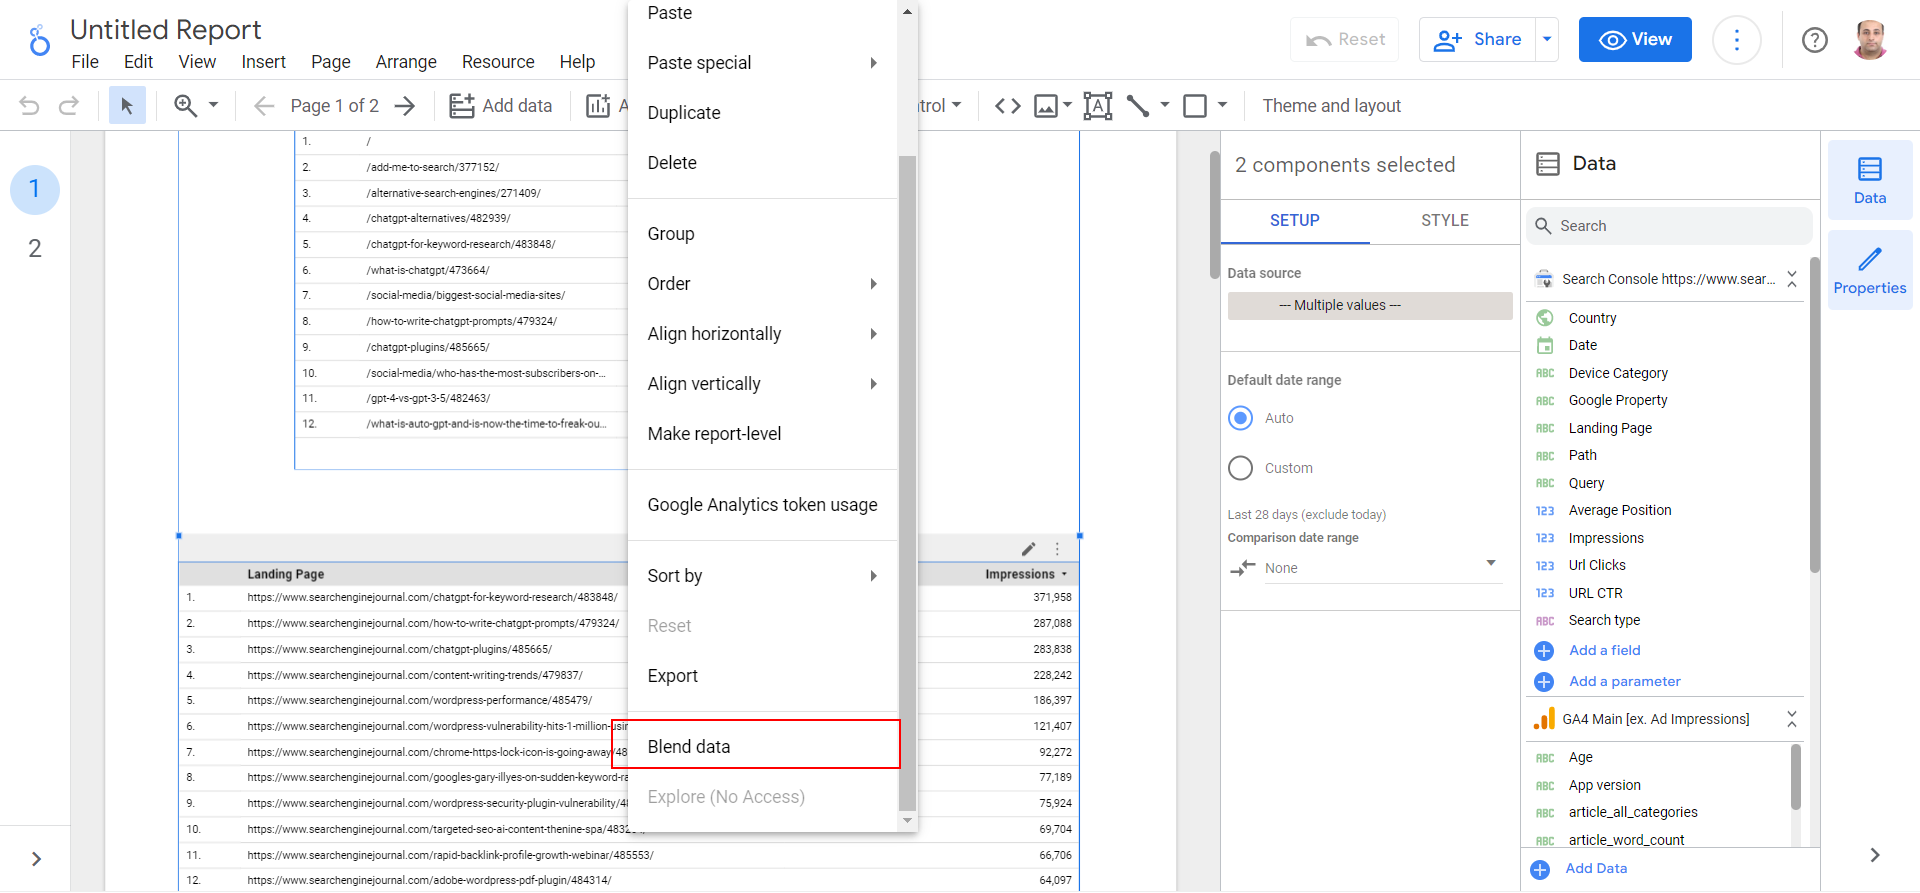
Overall, the fastest way to blend data is to select both tables, right-click on them, and choose “Blend data” from the menu.
-
 Blend data.
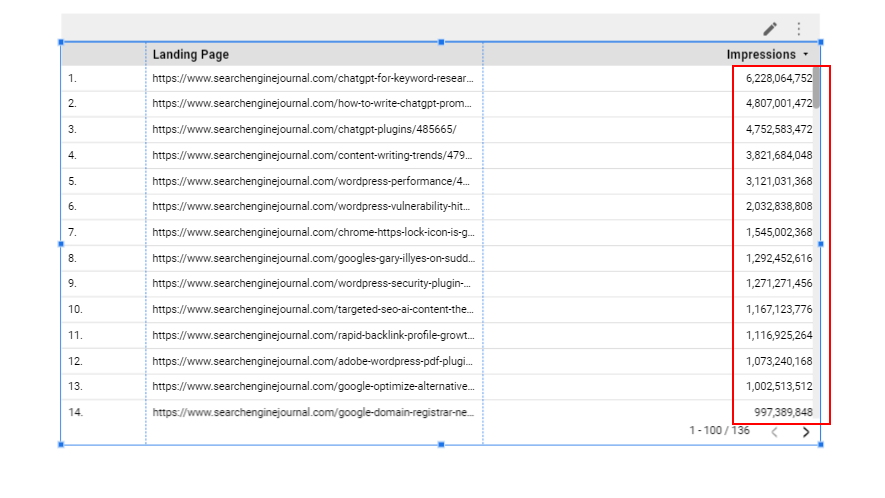
But if you try it with different sources, you will notice that the blended data doesn’t make sense, as shown below.
-
 Wrong data.
In some cases, this may work, for example, when you blend data from the same source – but when blending data from different sources, we need to create a new field adjusted “Page path,” which will have the same format and ID.
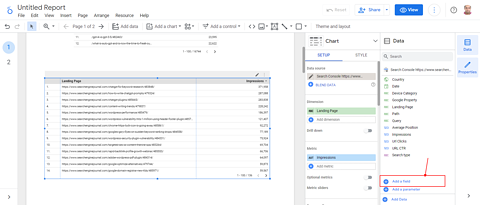
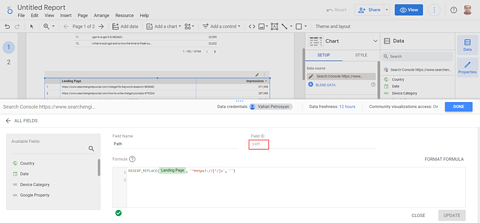
Let’s create a “Page path” in the GSC source as a new field that will use the REGEXP_REPLACE formula to remove the host from the URL.
The key point here is to set the field ID “path,” which will be the same when we create it in GA4.
Thus, Looker Studio is able to match dimensions and merge them.
Do the same with the GA4 source and create a “Page path” field with the ID “path.”
-
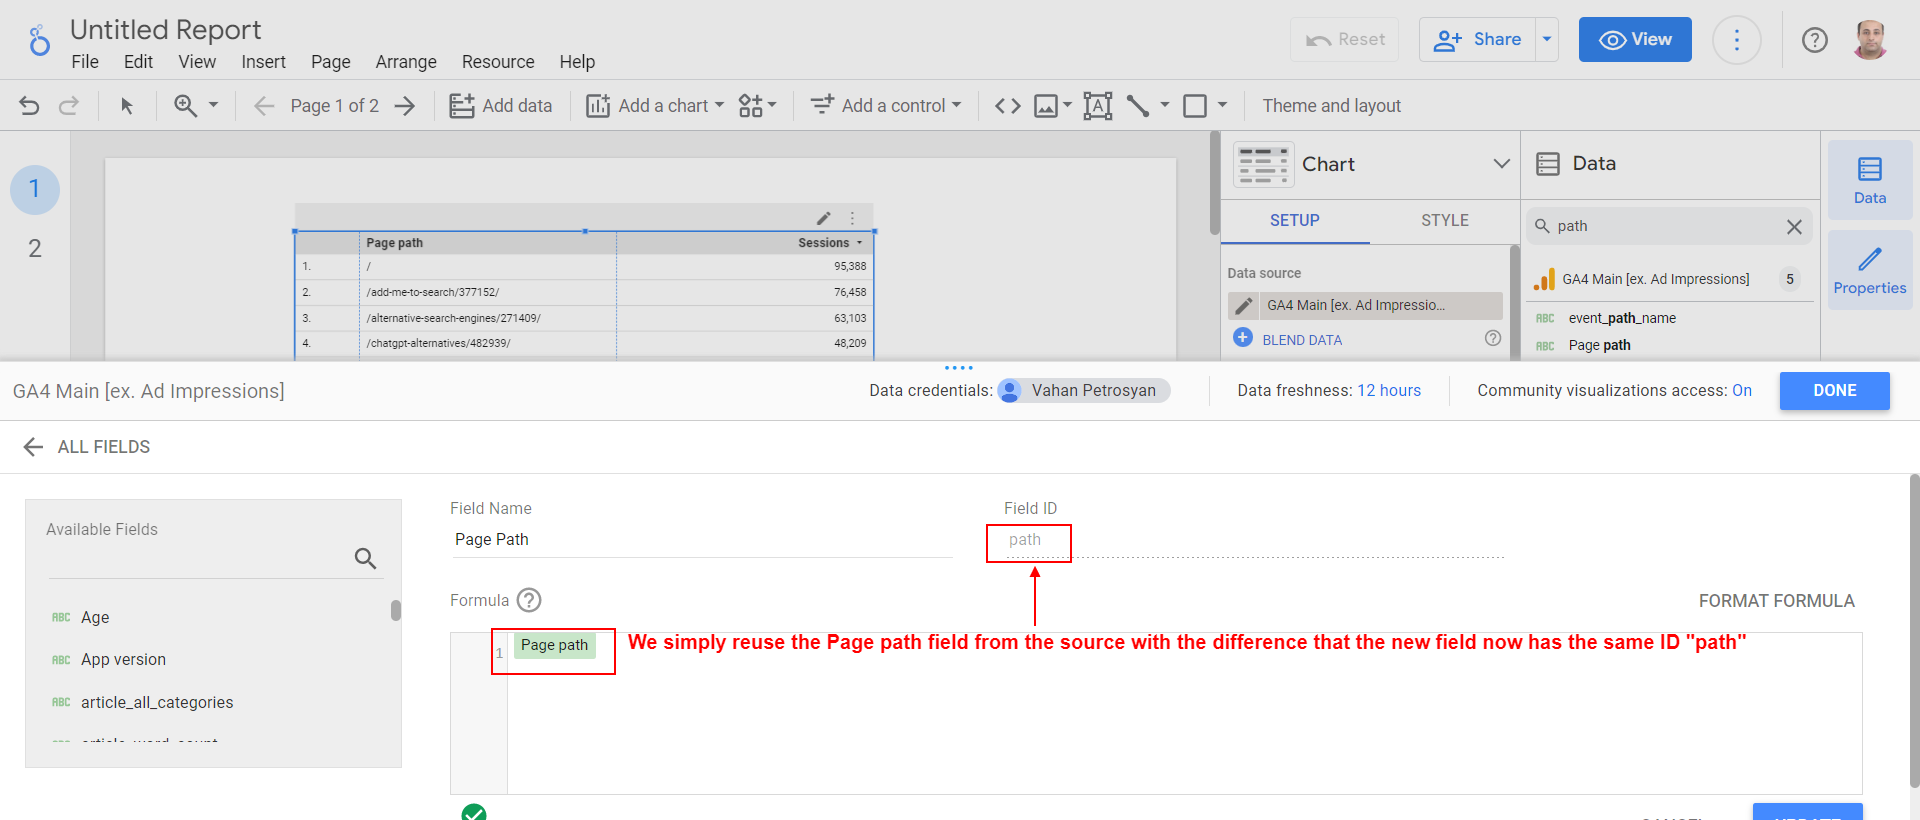 Page path new field in GA4 source.
Now in the tables, we’ve added replace dimension with the newly created field “Page path” (you can name it anything to easily differentiate them, the key is to have the “Field ID” be the same).
-
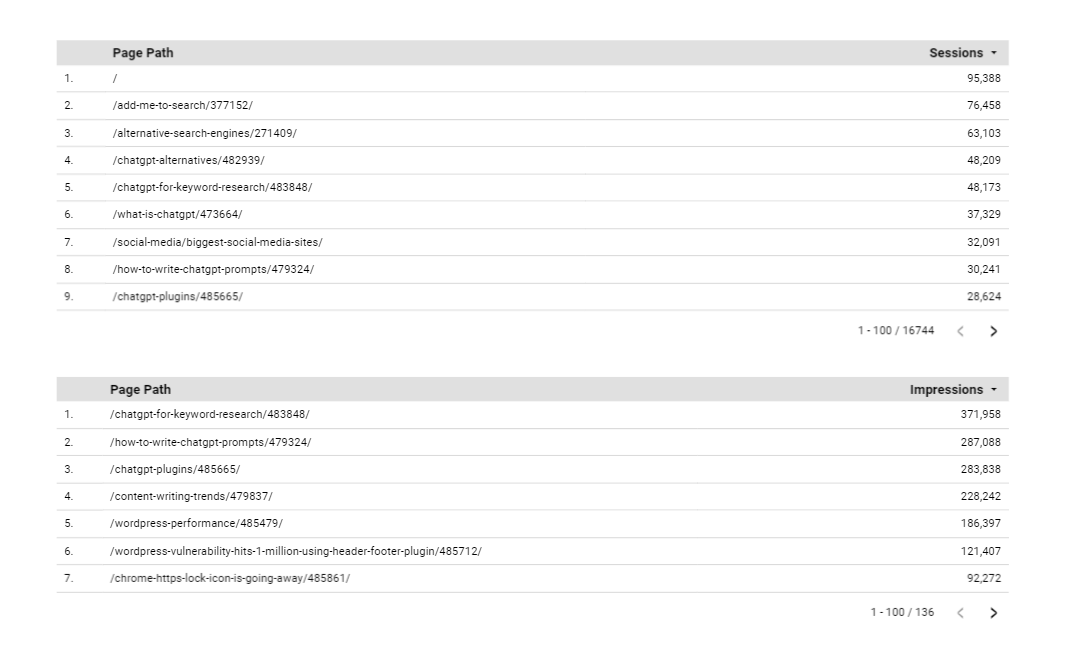 Tables that use page path new field.
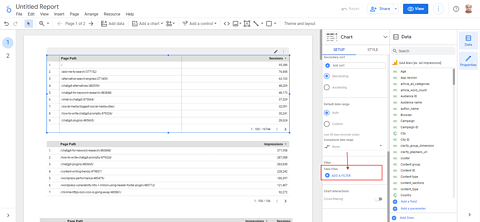
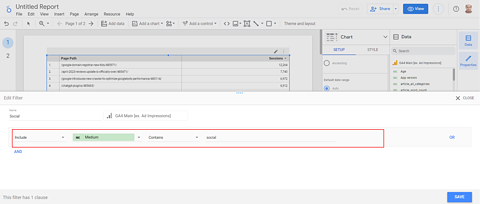
Now you have your data ready to be blended by using “Blend data” from the right click dialog shown above. But before that, we want to make sure we have only social traffic from GA4. For that, we need to apply a filter to the GA4 table by following these steps:
Add a Filter > Create a Filter, and in the popup dialog, set the filter name and condition Medium contains “social.”
Now you can blend data and have social traffic and Google Discover impressions side-by-side.
-
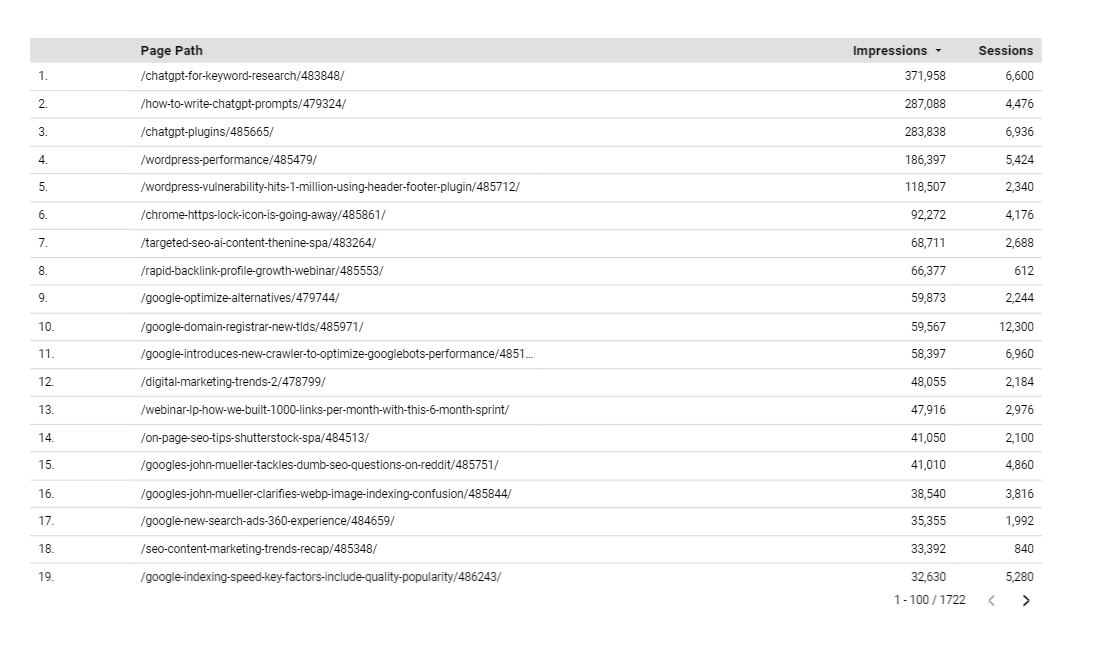 Impressions and sessions from social in one table.
If you come across “null” values in the impressions column for older URLs, it’s because GSC only has data available for newly published URLs.
As a result, data for older URLs may not show up in GSC, which can result in “null” values.
- This is a common occurrence and not necessarily indicative of any issues with your data or tracking.
Below is a simplified diagram that shows what blending means.
-
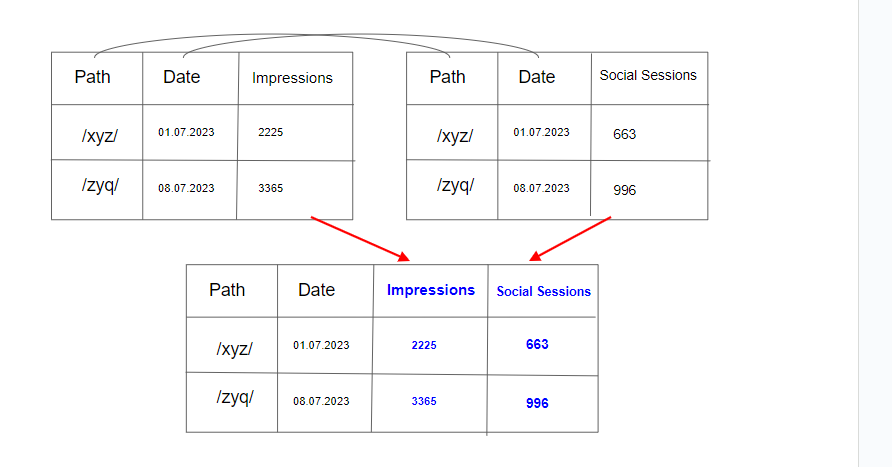 Image created by author, May 2023
But what if we want to see also how impressions and social traffic evolve over time?
For that, we need to edit the blended data source and drag it into a dimensions list and also a Date field.
(In other cases, you may need to replicate the step for converting dimensions into the same format and ID with the Date field, too. But in this case, since they are in the same format already and have the same name, it will work, as Looker Studio also matches using field name.)
-
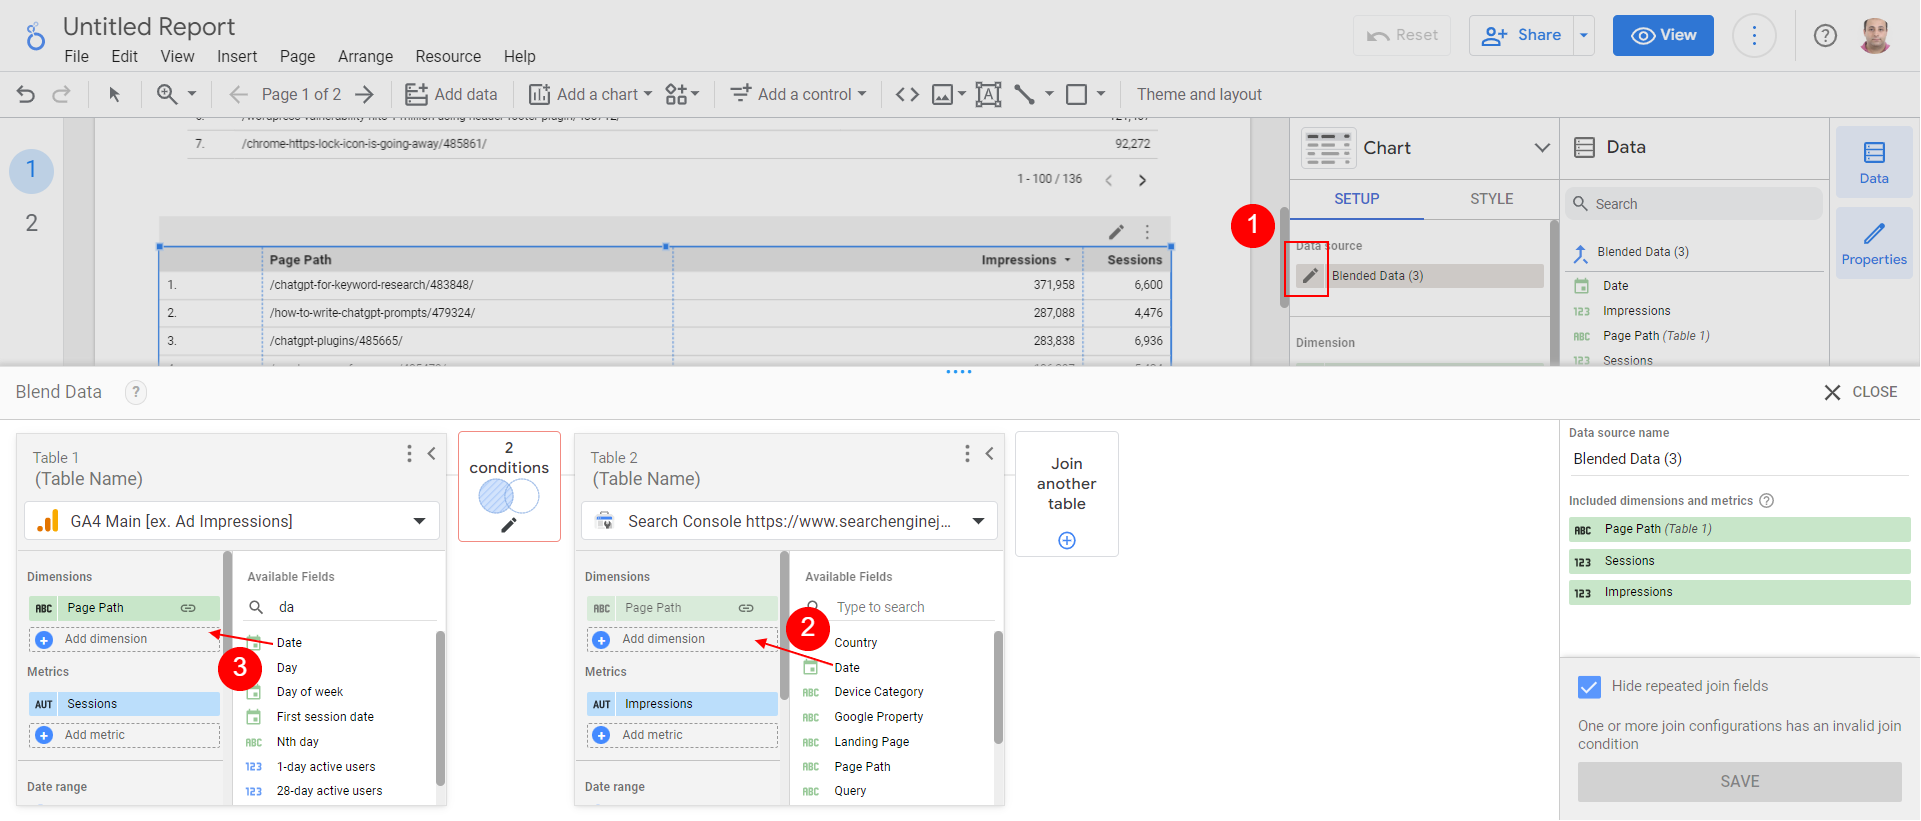 Add a date field.
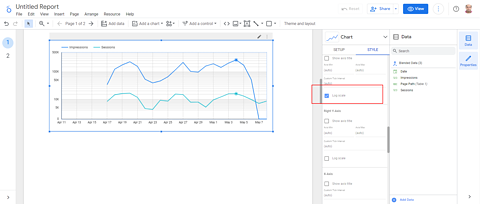
Now you can choose the Time Series chart type to see how Google Discover impressions and social traffic align with each other.
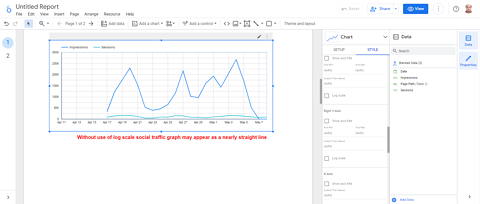
Since impressions are much higher than social media traffic, it helps to choose a logarithmic scale for better visualization.
After analyzing the data, it’s clear that there is a strong correlation between impressions in Google Discover and social traffic. The ups and downs of impressions align very closely with social traffic patterns, indicating that increased social media traffic leads to increase visibility in Google Discover.
(Please always remember correlation is not causation.)
Google Discover’s ranking algorithm is very different from Google Search.
Now, you may ask if there is a correlation between ranking and social traffic. Let’s explore that, too.
All the steps are the same with the difference being that you should add GSC’s web data table and include average position as a metric.
-
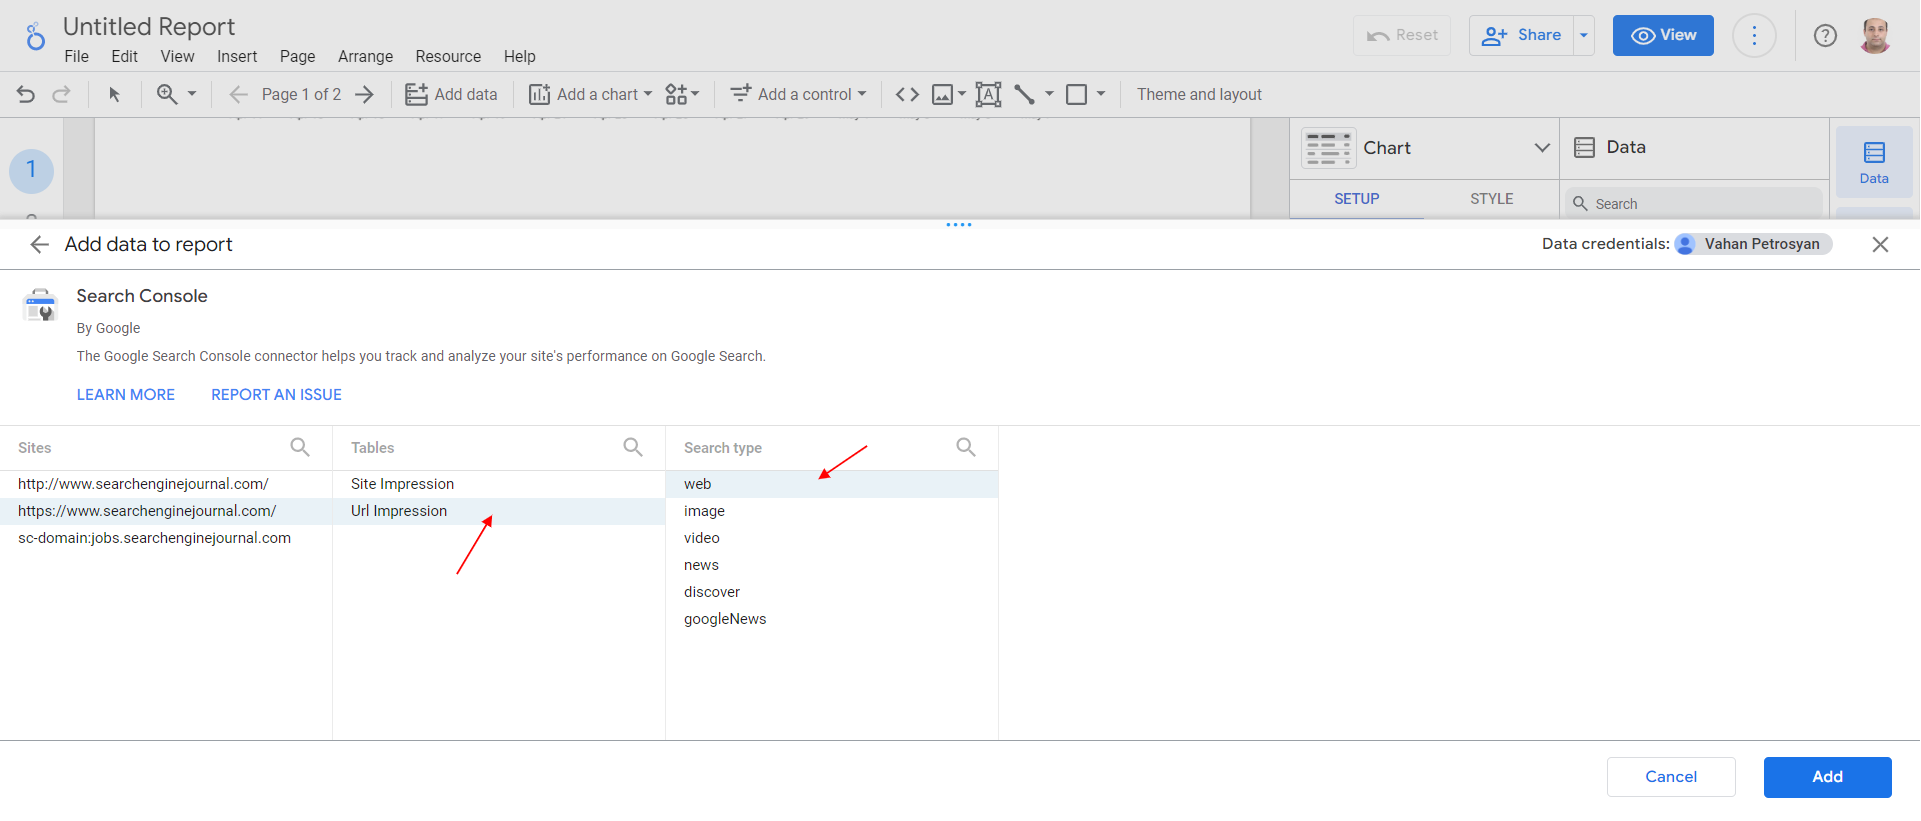 GSC web search data table.
After creating a new field, “Page path,” with the same Field ID “path” and blending, we see that there is no correlation between social traffic and ranking position in the search engine results page (SERP).
You can see that the ranking position isn’t changing while social traffic goes up and down. Thus, we can conclude that ranking position doesn’t correlate with social media traffic.
-
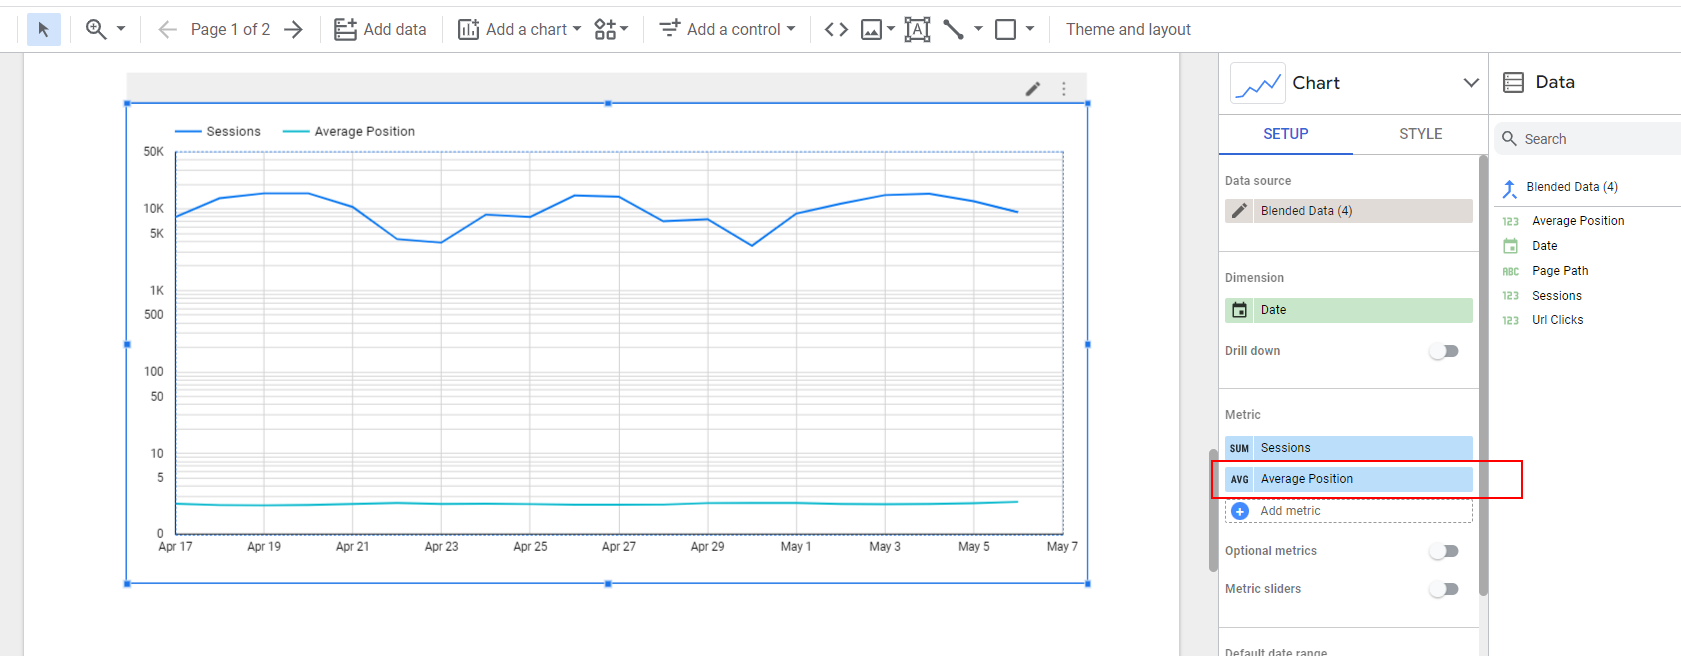 Social traffic and ranking position. (Log scale)
Conclusion
With these examples, you can see how many useful data insights you can get by combining data from different data sources.
Many of you have access to Ahrefs, Semrush, on any other SEO tool, and you can try to blend backlink data with Google Analytics referral traffic data to understand the impact of your backlinks on your website traffic.
The key principle here is to create dimensions in two data sets with the same Field IDs, which will be used in blending.
More resources:
- An In-Depth Guide To Get Started With Looker Studio (The New Google Data Studio)
- The Ultimate Google Ads Pacing Dashboard For 2023 (Free Looker Studio Template)
- PPC Trends 2023
Featured Image: Andrey_Popov/Shutterstock





![AI Overviews: We Reverse-Engineered Them So You Don't Have To [+ What You Need To Do Next]](https://www.searchenginejournal.com/wp-content/uploads/2025/04/sidebar1x-455.png)