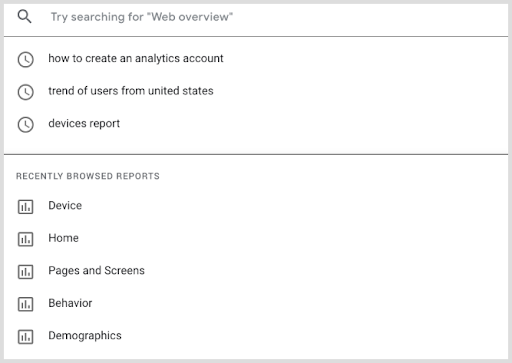
Google has integrated a new method of querying data in GA4 whereby you simply type a question or a phrase, and it creates the dashboard.
Imagine if you could do the same with your own SEO data – what would that do for your productivity?
In this article, you’ll learn how to configure your own dashboards using phrases and questions, creating an AnswerBox of your own with GPT-3 Codex and Streamlit.
Google’s Answer Box
In Google Analytics v4, you’ve probably noticed a clever search bar that allows you to get:
- Instant answers.
- Reports.
- Answers on configuration.
- Help.
Instant answers are particularly useful. By asking questions about your data, you get answers and – most importantly – ready-to-use reports.
There’s nothing magical about it. This technology relies on natural language processing (NLP), so you have to be precise about metrics, dimensions, and timing when asking for an answer.
For example, you can search for [conversions last week from the United States] and see the results in the search panel that appears on the right.

This new way of using a data visualization tool is incredibly powerful and will surely be integrated into all solutions of this type.
The time savings for the user are impressive, as users don’t have to search through all the views of the tool and no longer have to configure the view.
Everything is done automatically based on the instructions provided in the search box.
Can we easily do the same thing? And which data should we use?
Smart SEO Dashboard
Before requesting a report, you need to think about the important data to be taken into account.
I suggest you look into the concept of the Smart SEO Dashboard.
- The first requirement is to keep the graphs simple and specific. Less is always more.
- Next, the abscissa or ordinates must refer to measurable data. Otherwise, it is impossible to see the evolution.
- In addition, graphs must focus on meaningful parameters. It is useless to monitor parameters that will have no influence on your activity. Weather is an excellent example: it plays a crucial role on some sites and none on others.
- Dashboards should always include relevant summaries in order to be quickly read and understood. Generally speaking, if it takes more than three seconds to understand a dashboard, it can definitely be improved.
- Finally, the most important data is time. It is imperative to track time data by comparing each day, month, year, etc.
Now, you need to identify the best technology to generate this type of dashboard.
GPT-3 Codex
GPT-3 Codex is a computer code generator that was created in August 2021.
Access to GPT-3 Codex was given much faster than access to GPT-3.
Not surprisingly, GPT-3 Codex has been fed millions of quality source codes available on GitHub – that is, more than 54 million GitHub repositories.
Like GPT-3, it is a sophisticated neural network that is capable of self-learning.
GPT-3 Codex does not only work in Python. You can also generate code in Go, Javascript, Perl, and PHP.
On the other hand, GPT-3 Codex has only 12 billion parameters, unlike its big brother GPT-3 Da Vinci which has 175 billion.
Let’s take a closer look at this size-versus-cost ratio.
OpenAI’s experiments show that the size-versus-performance ratio of Codex follows a logarithmic scale.
This means that the performance gains gradually decrease as the size of the model increases.
Therefore, the additional costs of collecting data, training, and running a larger model are not at all worth the slight increase in performance.
All of these reasons explain why the model has only 12 billion parameters for its first version.
We’ve found an AI to generate the code.
Now let’s look for the best framework available at the moment to execute it all in a friendly interface with clicks and drag-and-drop.
Streamlit
Streamlit is an open source technology that allows you to quickly build very advanced user interfaces.
Streamlit also includes many very useful components to have even more interactions like:
- Session management.
- Password management.
- User management.
The community is particularly active and shares many handy custom modules for SEO.
To start, we’ll use GPT-3 Codex to generate graphs with Streamlit, and then attempt to produce a Streamlit app that generates the code and runs it automatically.
Two Excellent Examples For Querying The Data
First, we need to generate an app for Streamlit and run it.
1. With OpenAI (Semi-Automatic)
The first thing to generate is a Streamlit web app that retrieves all the logs from the month of May 1995 from NASA and displays the number of URLs crawled per day.
First of all, we need to retrieve the CSV file by specifying the name of the columns and the format if necessary.
For our example, it is important that the date is in UTC format.
Then you can ask OpenAI to display the graph of your choice, once it has understood your data.

From these instructions, you will have a working code.
Remember that we don’t want to copy and paste code, but drive everything through English instructions with a no-code approach.
2. With Streamlit (Full Automatic)
Here is an open source example based on one of Streamlit’s applications.
It is an app directly connected to GPT-3 Codex that generates computer code and allows you to execute it.
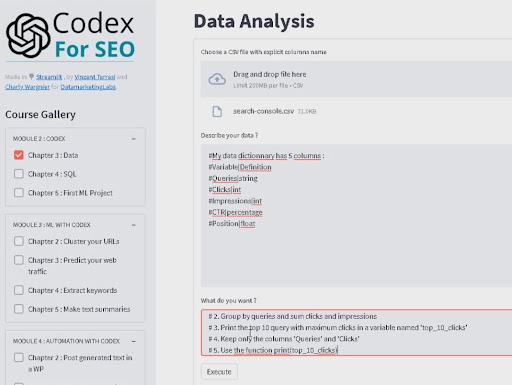
With Charly Wargnier, we did the same thing but for SEO use cases in an app called “Codex for SEO”.
In one click, you can import your data.
Then, you can describe the content of the imported file: What are the columns? What are the data types?

Then you specify your instructions.
In our example, we ask it to group the queries together and to sum the clicks and impressions.
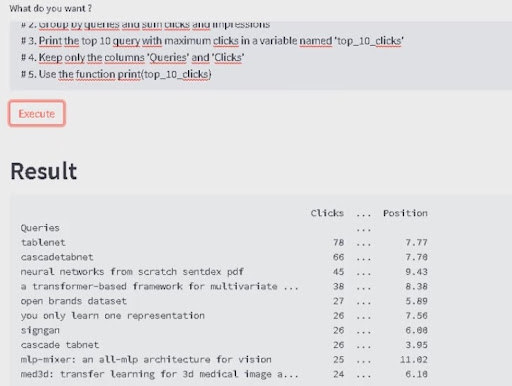
We’ll tell it to keep only the columns we’re interested in (the Queries and Clicks columns), and then click the Execute button.
No line of code is needed to get the results, and everything is generated by the OpenAI Codex and executed by Streamlit.
Our proof of concept is therefore validated with many different use cases.
Moreover, if you need assistance, everything you need for this is accessible via a training program with 150 minutes of video.

For educational and transparency reasons, we have provided the generated code as well as the results.
And with that, the SEO AnswerBox is now available for everyone to create!
More resources:
- How to Set Up Your Google Analytics 4 for Success
- How to Generate Quality FAQs & FAQPage Schemas Automatically with Python
- Is Using Google Analytics A Search Ranking Factor?
Featured Image: NicoElNino/Shutterstock


