Calculating ROI for SEO is one of the biggest struggles most SEO professionals face.
SEO pros have the benefit of keyword volume data that provides insight into what people are interested in (data that other channels may not have).
But being able to understand what the lift would be if you make changes for SEO can be a bit of a conundrum.
In this article, I will walk you through how I have perfected the art of estimating lift for SEO.
Note: I will be using my own WordPress site that I developed to help visitors and residents of the island I live on. It’s a site I use to test out SEO ideas on, and a good use for examples in this article.
How to Calculate ROI for SEO From Keywords You’re Targeting
The foundation for most SEO work begins with a keyword analysis.
Google, and most SEO tools, provide data around how often users are searching for specific terms.
This data is used most often for paid search to estimate the performance of ads, but SEO professionals will tend to use this data to help them identify where the opportunities lie.
1. Complete a Keyword Analysis
Gather your keyword estimates from your keyword analysis.
You can use Google’s Keyword Planner if you have a Google Ads account, or there are many free or paid tools that use the same data you find in Keyword Planner.
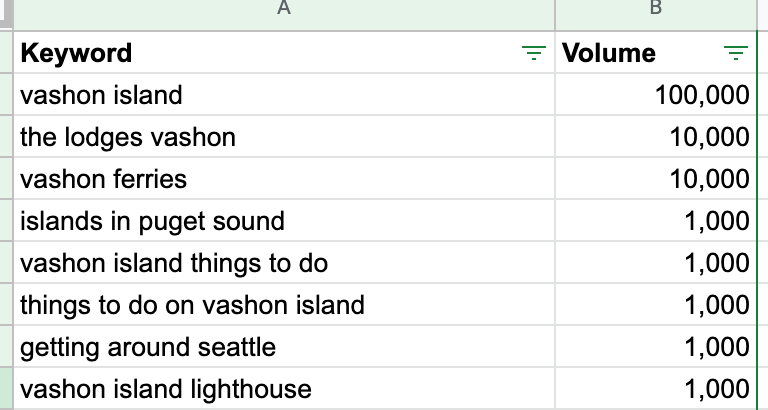
Basically, all you need are the words you want to target with their estimated search volume data.
Your data should look something like this:
2. Download All of Your Keyword Data
When you know what terms you are going to target for a project, the next step is to calculate what the difference would be from your current performance against what your estimated lift is.
Let’s say I want to do a project to target terms that contain “Vashon” (which the site already ranks for) or “things to do” type of terms for the island, and maybe try for additional searches for islands and places to visit around Seattle (since this island is just a ferry ride away from West Seattle).
I want to compare this list of terms and estimated volume with what we are currently ranking for.
Ideally, I want to see current impressions, clicks, click-through rate (CTR), and average position as reported in Google Search Console.
The trick is getting 12 months of data for all keywords to get to that ROI for SEO.
Unfortunately, Google limits the data for keywords and pages to under 1,000.

A workaround for this is to use a tool that can access all of your keywords and allow you to download this data.
SEMrush, BrightEdge, Conductor, and other tools that require payment will provide you with that data.
However, if you have a limited budget, or want to just download your keywords, you can use a free trial of Keylime Toolbox.
I highly recommend using Keylime Toolbox to store your keyword data, and some of their premium features come in pretty handy.
For this exercise, I’ll walk you through how to set up a free account and collect your data.
Start by selecting the “Free Trial” link in the top navigation

Set up contact information and then add your properties.
If you “Sign in with Google” using the same account that you manage your Google Search Console under, then the system will automatically recognize your GSC properties.
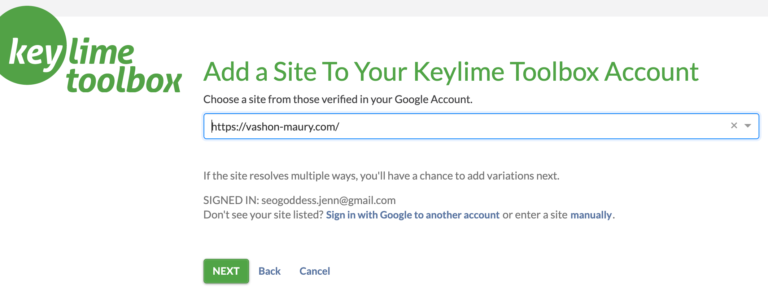
You’ll need to add accounts@keylimetoolbox.com as a new user to your GSC (make sure you set it as “Restricted”).
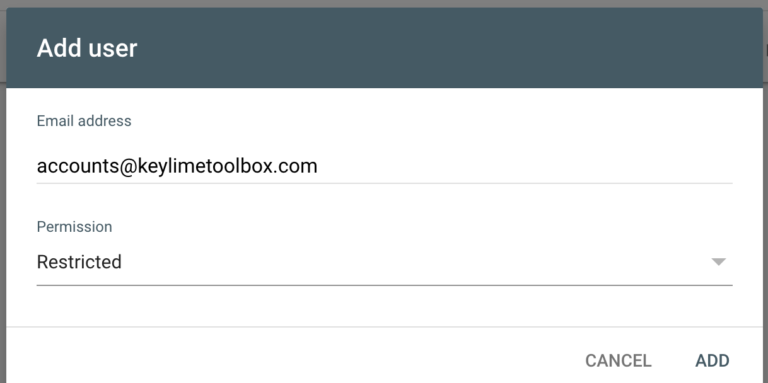
Then select which Google Analytics property your website is under and allow Keylime Toolbox to authorize the user.
Keylime takes a day or two to populate your account with all of the data, so be prepared to wait a bit for the next step.
3. Calculate Current CTR per Average Position
Once you have all of your keyword data populated in Keylime Toolbox, you’ll want to download 12 months’ worth of all of your keywords and data into a CSV.
I like to copy and paste the data into Google Sheets so that I can share it with my team easily, but you can use Microsoft Excel as well.
The data that is most important for the purpose of this exercise is the click-through rate (CTR) and the Position (average ranking position).

Next, we are going to set up a sheet that holds the average CTR based on the average position using the “AVERAGEIFS” formula to lookup the position and average out the CTR across all of the keywords.
It should look something like this:
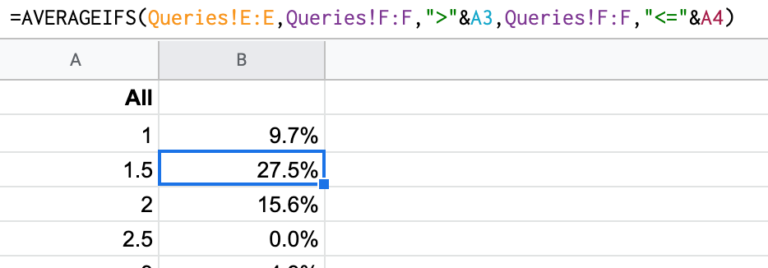
When targeting a specific set of terms (for example branded terms) I like to break out the average CTR by position for those terms.
By using the “AVERAGEIFS” formula, we can focus on the average CTR for the specific position for any term including “vashon”, or “things to do.”

This is particularly helpful because branded CTRs tend to be higher than non-branded searches for most organizations.
4. Identify Keyword Gaps & Opportunities
Now that we have our identified keyword opportunities from our Keyword Analysis, we need to see:
- Which keywords we currently rank for.
- Where we rank.
- How many impressions we’re seeing.
- What the CTR is.
- And ultimately how many clicks.
Using the same Google Sheet set up with the current Keywords data (export from Keylime Toolbox), CTR data that we calculated (in separate tabs).
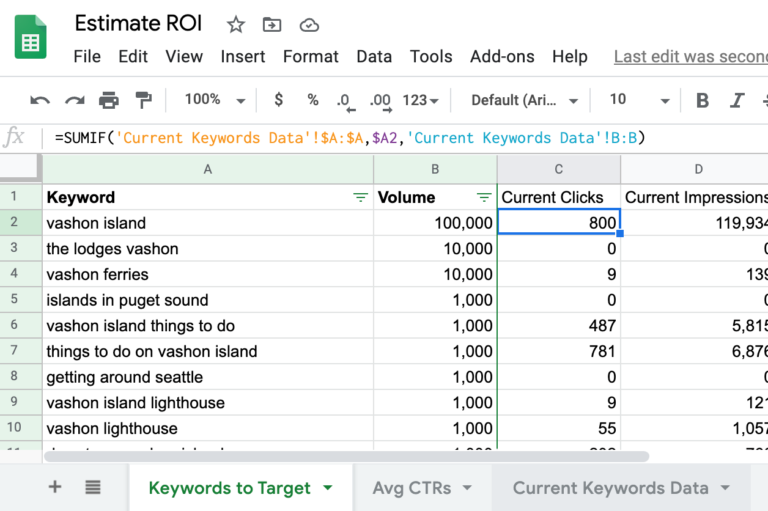
We’re going to use the tab that has our Keyword Analysis (keywords and volume) in a new tab (I called it “Keywords to Target” in my example here).
In the columns next to “Volume,” I added the current clicks, impressions, CTR, and average position.
Using the SUMIF and AVERAGEIF formulas I set up a lookup for each term to get a view into how each term is currently performing.

Note that this should all be average per month numbers from 12 months of data.
So your totals for impressions when in the first few positions should round up/down to match the “volume” numbers. ![]()
5. Summarize Your Keywords
When my keyword analysis brings back a long list of keywords to target, I like to set up a “Summary” tab using “SUMIF” and “AVERAGEIF” formulas to get a high-level view into where opportunities will be.
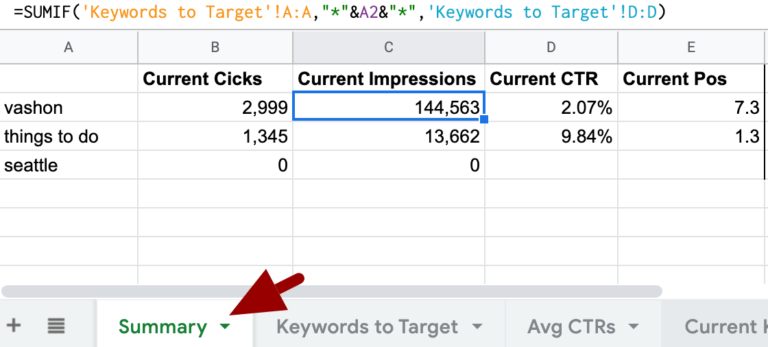
Notice how there are no impressions, clicks, and other data for keywords around “Seattle?”
Those are the opportunity terms that I would like to target for a new project.
Now that I see we don’t have current data, I need to calculate what our potential clicks could be.
This is where the average click-through rate data we collected will come in handy.
6. Estimate Clicks From Volume Data
We know what the estimated impressions will be (from our Keyword Analysis using “volume” data), so we will use the “SUMIF” formula to calculate the “estimated impressions.”

The rest of the data here is where we need to reverse our calculations.
Basically using a proposed average position to estimate CTR data to then calculate what our estimated clicks would be.
However, we don’t know what the average position is currently. This is where we need to use our best judgment on where we think we can rank for these terms.
In this case, the terms I want to target don’t have a lot of competition, and the domain authority of the site I am working on is pretty strong for local searches, so I think I can realistically obtain the third position for these terms.

In our Average CTRs data, the 3rd position usually sees a 6.7% CTR.
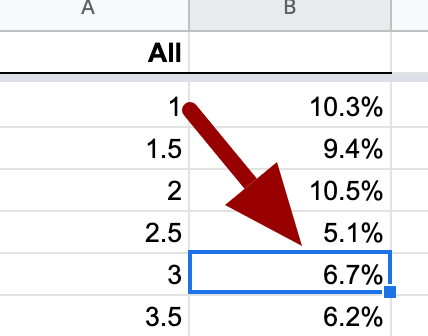
Using the “AVERAGEIF” formula, we’ll look up what the average click-through rate is for the 3rd position. 
By using the formula here (instead of just typing it in, or using a VLOOKUP) we’re making this sheet easy to change later on for future estimates.
If I want to see what the estimated clicks would be for a 2nd position or maybe a lower position like 5th, then I just change the “3” to a “2” or “5” and the numbers will automatically update.
Now, all we need to do is multiply our impressions by our estimated CTR to get the estimated clicks for our particular project.

Remember that these estimates are for average per month for a 12-month period, so if you want to do some additional calculation for a quarter you would just multiply that by 3 (for the three months in the quarter) and by 12 for a total yearly estimate.
If you know what your average conversion rate and revenue per conversion are you can use those numbers to estimate revenue for the project you want to do.
For work you want to do to improve on terms you already rank for (a.k.a., “low-hanging fruit”) you can enter in the position you think you will be able to obtain and use the same calculations.
(See above example where I entered “5” for the estimated average position for “vashon” terms which would then see a potential increase in clicks.)

Summary
It takes a bit of time to get these numbers together.
But setting up a sheet to work off of with your current CTR data based on average position will help you in calculating your estimates for just about any project for SEO.
I saved the Google Sheet I used to create these screenshots.
You can save it as your own and play around with the data, or enter your own data and calculate your ROI for SEO.
More Resources:
- How to Calculate the ROI of Your SEO Campaigns Using Google Analytics
- Measuring SEO Value Beyond Rank & File: How to Attribute Content Value
- A Complete Guide to SEO: What You Need to Know
Image Credits
Featured Image: Dreamstime
All screenshots taken by author, October 2020


![AI Overviews: We Reverse-Engineered Them So You Don't Have To [+ What You Need To Do Next]](https://www.searchenginejournal.com/wp-content/uploads/2025/04/sidebar1x-455.png)