It’s quality over quantity these days, right?
While it is 100% true that you should always be creating the highest quality content for your users and the various search engines, there is also power in knowing where you stand against your competitors.
It’s good to know the amount of quality content being created on both sides.
Think of it this way, if you are creating very high-quality content on a weekly/monthly basis.
A competitor is creating 2x high-quality content on a weekly/monthly basis.
While another is creating 5x high-quality content on a weekly/monthly basis.
Who wins?
Most would say the user – which is a sunshine and rainbows answer.
The true answer, though, is the competitor creating 5x high-quality content.
One of the things I’ve always found funny about the SEO industry is our ability to mark something as completely evil, and condemning it for all of eternity.
I’m guilty of this, too, but we have to take a step back and recognize that doing things in large quantities isn’t always bad if they are being done correctly.
What Is Content Velocity?
To put it simply, content velocity is measuring the amount of content a brand is putting out during a defined period of time.
If you wanted to compare your content velocity versus your closest competitor within a given quarter, you would be measuring how much content you put out for that quarter versus how much content they put out as well.
Why You Should Care About It
There are many use cases for measuring and reporting on content velocity.
It all just depends on what point you are trying to make.
Here are the ones I feel are most impactful.
1. Making a Case for More Resources
One of the best ways to utilize this data is to make the case to get more resources to create content, especially if you’re behind.
Executives hate losing to and love beating and staying ahead of their competitors.
Looking at competitive content velocity and comparing it to your own is a great way to prove to your executives that you need more resources.
Regardless of whether it’s to catch up and overtake, or to stay ahead and continue to bury them.
2. Determining Your Competitors’ Resources
On the opposite side of making the case for more resources for your business, you can use content velocity to determine how many folks are working in your competitor’s content program as well.
This gives you a data-driven way to determine how many folks competitors have on staff.
Whether it is full-time resources, freelance writers, or a mix of both, knowing this information allows you to plan your approach accordingly.
3. Estimating the Cost of Content
Using this data you can also estimate how much money is being spent on content across your competitors and how much it will potentially cost you internally.
While it’s an estimation, it gives a clearer picture of how much cost is potentially involved in making the content program you want to launch a reality.
The business can get their arms around the program using a data-driven approach and make it work within your budget.
How to Calculate Content Velocity
Calculating content velocity can range from pretty simple to very complicated.
In its simplest form, you can do it using a couple of standard tools that most SEOs have access to like SEMrush and Screaming Frog.
The first step is to get the blog/article pages that exist on a site.
it’s as simple as going into SEMrush, filtering down to those pages using the URL filter function, and exporting the final list.

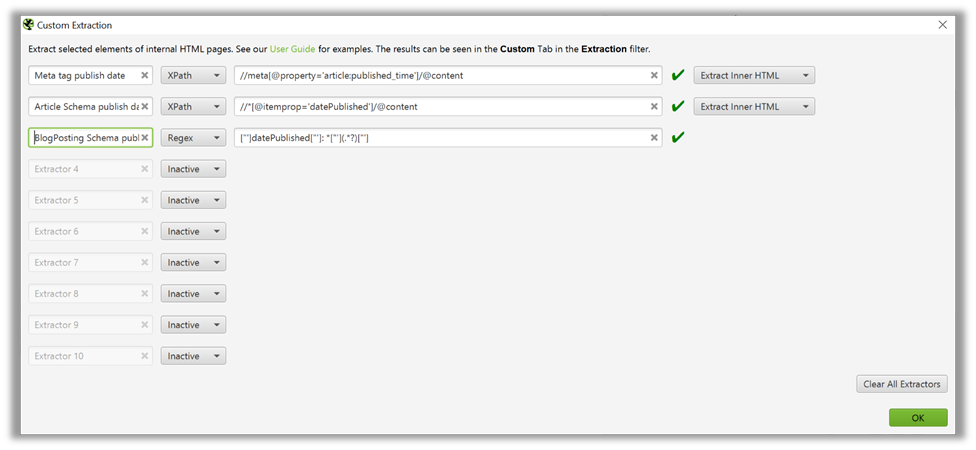
Next, you want to take those URLs and put the list into Screaming Frog and set up a custom extraction.
This will pull in the publish date that will allow you to analyze how often content is being created for a site during a certain period of time.
The most typical type of extractions for publish date through XPath and RegEx are:
- Metadata.
- Article schema.
- Blogposting schema.
While this won’t address every site you can easily investigate to see how publish dates are handled and set up the custom extraction from there.

Once the crawl is run through the URLs you will then have a list that pulls out the publish dates.
That will allow you to pivot the data and see the amount of content that is being created for a given site during a certain period of time.
Pro Tip: If available you should also pull the author of the article during this process for a separate use case which we will get to later in this article.
You can repeat this process for all of your competitors and get the basic velocity metric to compare who is winning and losing.
To go deeper and provide additional layers of insight, you can also look at metrics such as word count.
That not only allows you to see how long each piece of content is for a site on average but also estimate the cost a competitor is spending on each page.
And that gives you an idea of how much you may have to spend to compete.
For example, most freelance writers or writing services charge .25c -.30c per word to create a piece of content.
If you have a competitor site that has an average of 1,000 words per page, you can calculate that it cost them anywhere from $250-$300 to create that content on average.
Then you can use that amount to calculate what the total cost would be to create the same amount of content during the time period you’re looking at.
Using this data, you can then create a nice-looking slide that you can show the powers-that-be how you are doing versus your competitors.
And ballpark how much it will cost to compete, therefore making the case for budget, resources, etc.
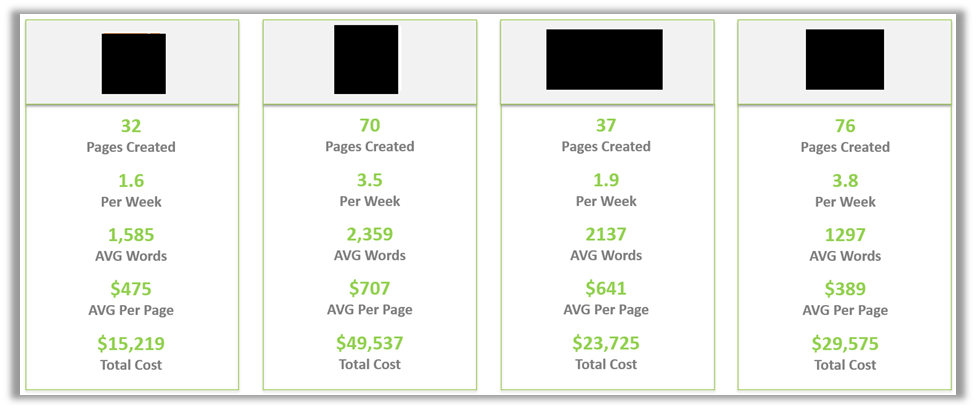
The final product looks something like this:

Using the process above we can show that during a certain period of time:
- The number of pages created.
- The number of pages created per week or per month on average.
- The average word count.
- The average cost per page.
- The total cost over the course of the period of time you are looking at.
This is a great way to show where you stand against your competitors from a content perspective, but also plan out how your content program needs to shape up to beat and compete.
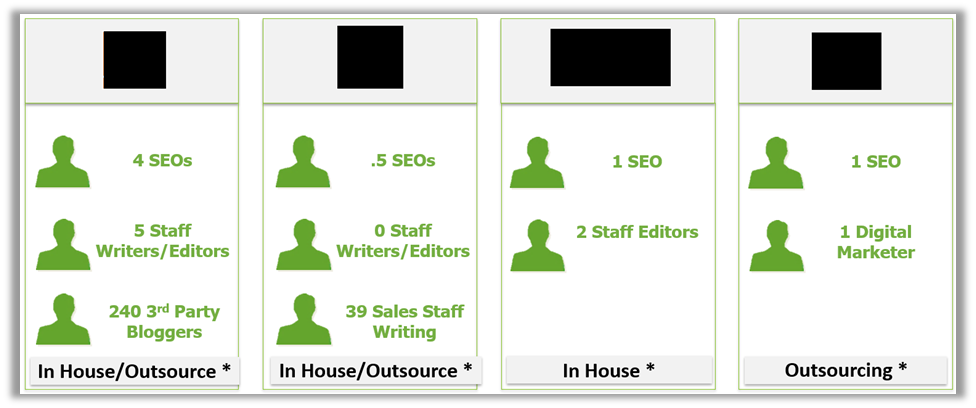
Now if you want to take it a step further, you can also look into what the writing and SEO teams look like for the same competitors to get a full picture of how they are structured.
To do this there are a couple of different paths you can take.
As mentioned earlier, if you are able to pull the authors from the site, you can see how many different folks are writing for it and create a profile on how their team is structured.
The second path is to manually go through LinkedIn and search for folks within their organization that have “content,” “copywriter,” “SEO,” etc., in their titles and see what comes up.
This will allow you to get the most recent profile for the team.
If you have a list of authors from the custom extraction process, you can cross-reference them here to see if there are any discrepancies.
Which will give you further insight into how their team is built out.
The third – and I am not saying I condone this, or have done this before – is to scrape your competitor’s company LinkedIn profiles and gather the data quickly for analysis.
Again, I am just saying it’s possible.
After you run that process you can create a nice visual that gives everyone a view of how your competitor’s teams are built that could look something like this:

The Takeaway
At the end of the day, not enough people talk about content velocity in general.
Everyone just wants to create a bunch of quality content and just keep doing that.
Very few organizations take the time to not only look into what types of content their competition is creating but how much over a certain period of time.
Figuring out content velocity is time-consuming.
But it yields a plethora of valuable information that you can include in many different use cases.
You have to take in a lot of different data points, some may require some serious engineering muscle depending on how deep you want to go.
Figuring out how many writers a competitor has on staff and how often articles are written is key to measuring/predicting how much content you need to create to compete for the topics you want to win on.
It isn’t just about creating great content.
It’s about creating the same amount of great content as your competitors who are winning to take away market share and stay ahead in the long term.
More Resources:
- Measuring SEO Value Beyond Rank & File: How to Attribute Content Value
- Content With Purpose: How to Set Goals for Every Content Piece You Create
- Content Marketing: The Ultimate Beginner’s Guide to What Works
Image Credits
All screenshots taken by author, September 2020


