
Video summary:
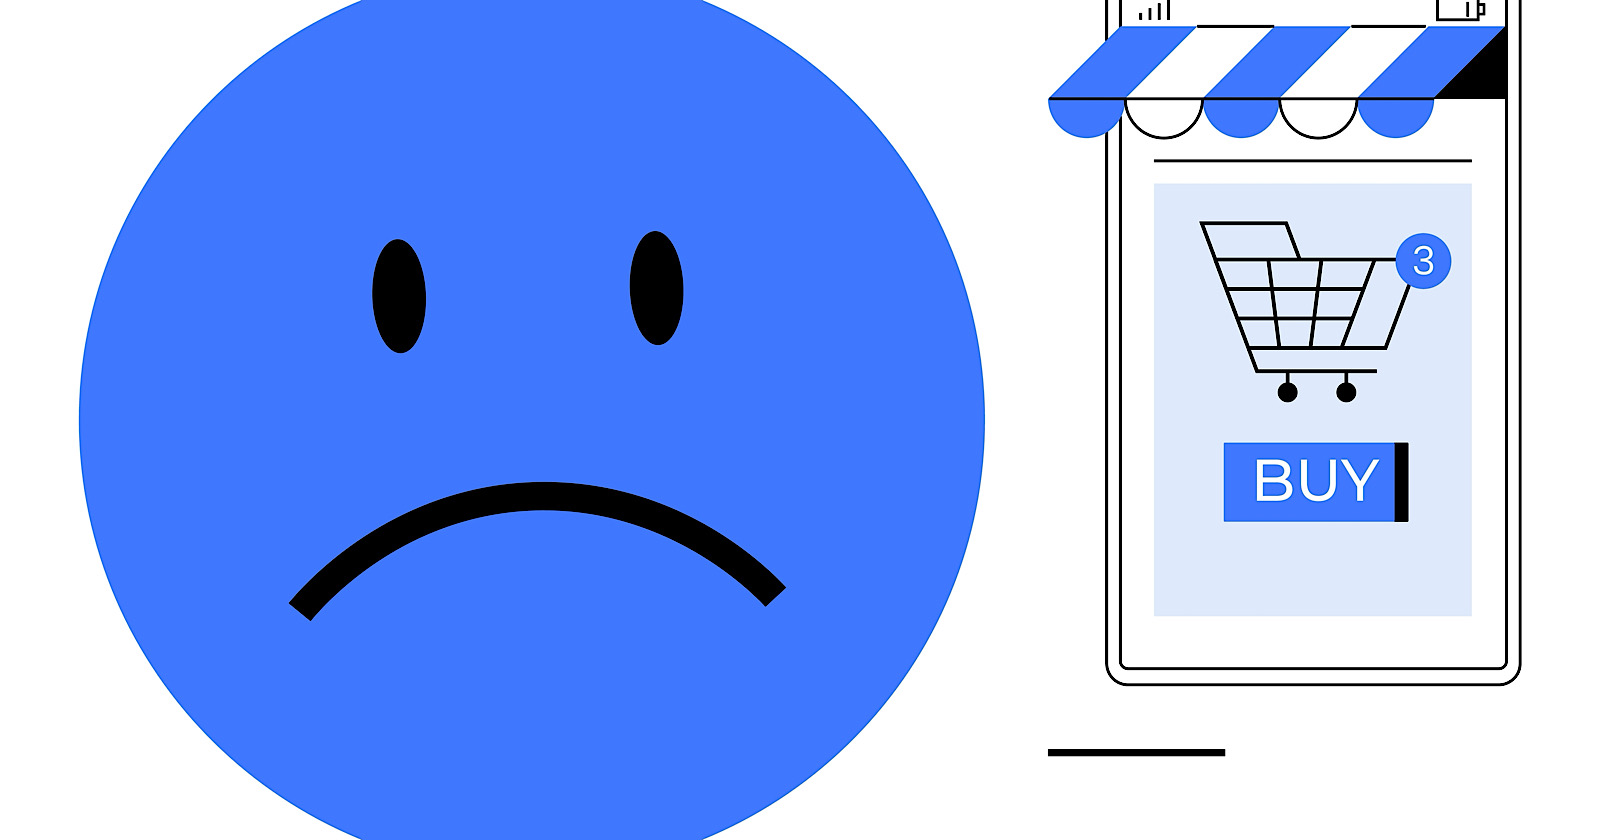
New data shows what many marketers already suspect: it’s getting harder and more expensive to convert online visitors.
A study of 90 billion sessions shows organic traffic is down from last year, pushing more brands toward paid channels to make up the difference.
This information comes from Contentsquare’s Digital Experience Benchmark Report, which examines changes in traffic patterns and highlights growing user frustrations.
Key Trends Shaping Today’s Digital Experience
1. Increasing Traffic Costs
Global website traffic dropped by 3.3% year-over-year (YoY), forcing brands to depend more on paid ads.
Paid sources now account for 39% of all traffic, a 5.6% increase. Organic and direct traffic fell by 5.7%.
With digital ad spending rising by 13.2%, the average cost per visit increased by 9% compared to last year and by 19% over two years.
2. New Visitors Leave Quickly
User engagement metrics are declining globally, with overall consumption (like time spent, page views, and scroll depth) falling by 6.5%.
New visitors viewed 1.8% fewer pages YoY, while returning visitors had a slight increase (+0.5%).
Most sessions that started on product detail pages (PDPs) ended immediately, underscoring the risk of overly transactional landing pages.
3. Frustration Hurts Retention
“Rage” clicks (clicking a page element at least three times in less than 2 seconds) and slow load times affected one in three visits and reduced session depth by 6%.
Sites that addressed these frustrations had 18% higher retention rates than their competitors.
4. Conversion Rates Decline
Global conversion rates fell by 6.1%, worsened by the lower yield of paid traffic (1.83% compared to 2.66% for unpaid traffic).
High-performing brands countered this trend by enhancing engagement: sites that improved session depth saw a 5.4% rise in conversions, while others faced a 13.1% drop.
5. Retention Starts On-Site
Despite a 7% YoY drop in 30-day retention, returning visits grew by 1.9%, driven by paid ads (+5.6%YoY).
Sites with strong retention had 17% fewer rage clicks and 18% more page views per visit, showing that smooth experiences lead to customer loyalty.
What This Means For Marketers
Here are some actionable insights for digital teams:
- Diversify Traffic Strategies: Explore new channels, like retail media networks, to reduce dependence on unstable paid ads.
- Improve New Visitor Journeys: Use heatmaps and personalized content to lower early exits.
- Address Frustration Proactively: Implement real-time monitoring to tackle rage clicks and slow load times.
- Leverage Analytics: Use behavioral data to identify high-intent visitors and improve their pathways.
Methodology
Contentsquare’s report analyzed 90 billion sessions, 389 billion page views, and 6,000 global websites from Q4 2023 to Q4 2024. The metrics covered various sectors, including retail, travel, and financial services.
Featured Image: robuart/Shutterstock
