One of the things that are so overwhelming about Facebook Ads is the data.
SO. MUCH. DATA.
It’s easy to get analysis paralysis if you aren’t careful.
On the other hand, the overwhelming data can also cause advertisers to just stick to a few metrics they feel comfortable with, and not explore anything else. Usually, these are things like cost per conversion or return on ad spend.
The danger?
If those metrics start going downhill, it can be hard to diagnose what’s causing it without knowing where to look.
Knowing the metrics to keep a pulse on aside from the ones that are your end-goal can save you a lot of scrambling later.
So what Facebook ads metrics should you look at besides the obvious stuff? Let’s talk about three of them.
1. Frequency
This is the most important point I try and impress on people: check your frequency.
Facebook earns money on a CPM (cost per 1,000 impression basis) so they want to show your ads as much as possible.
This can become a real problem, especially in the following situations:
- Retargeting: These tend to be smaller audience sizes, and advertisers frequently put a large budget toward it to maximize coverage. Don’t do it at the cost of annoying your audience. I have had retargeting results soar just from reducing budget to get the frequency under control.
- Conversion-focused campaigns with audiences under 1 million: If you have a really high-stakes conversion that doesn’t happen a lot, that means a small portion of your audience is likely to perform it. So if your overall target has 200,000 users in it, but it’s focused toward a Purchase action, you will burn through the users likely to Purchase pretty fast.
Facebook doesn’t allow you to cap frequency in any campaign type other than a Reach campaign. Your best mechanism to control it is to reduce your budget.
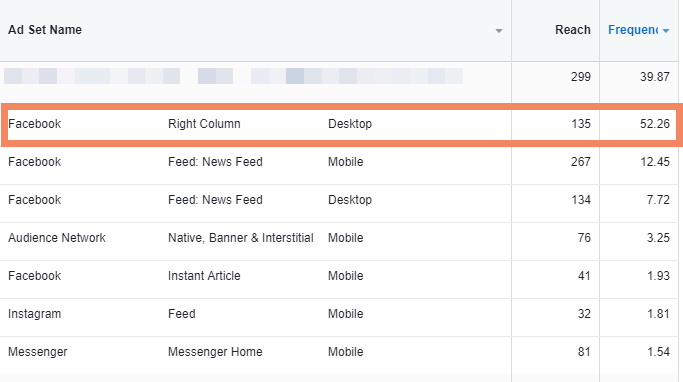
Don’t let this be you:

The worst offenders of this tend to be dynamic product ads, so watch those especially carefully.
If you see a high frequency, first check by placement and see if it’s just a particular one that’s causing the problem.
If you run in the right-hand column on desktop placements, you will almost always find this to be an issue (likely due to lack of ad inventory because performance tends to not be great).
You can check this by going to the Breakdown option and choosing Placement. I’d recommend doing this at the ad set level (not the campaign level):

2. Relevance Score
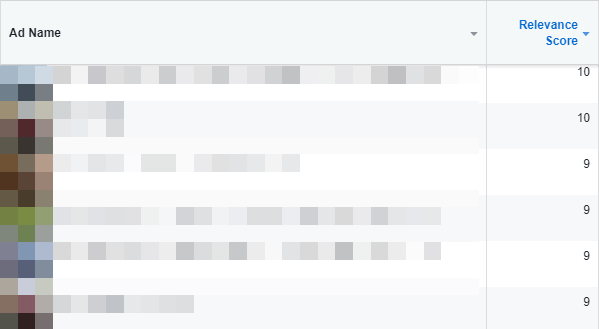
Much like the quality score in AdWords, a relevance score is how well your creative seems to be resonating with the audience you’re targeting. It can be found in the Ads section.

The score falls between 1 and 10, and a higher score is desirable because it helps reduce your CPM.
Facebook likes to show things that users interact with and respond to, so they reward advertisers monetarily who manage to do that with their ads.
Relevance score can be tough because you might not know exactly why you have the score you do. I tell people to not get too hung up on this because something with a low score can be something that’s driving sales and success for you.
However, when you have a piece of creative that has a high relevance score (and is doing well for you otherwise), it’s good to take note of them.
Look at things like the number of post comments, read through the comments it’s getting, and try to distill down what it is that works about it.
Not only will it help your creative endeavors in the future, but you can also re-use that creative’s ID in other campaigns so all that social interaction carries over and helps the CPM in other ad sets.
3. Video Percentage Watched
Video is all the rage these days, but many advertisers get hung up on it as a conversion tool.
While video can do great at driving sales and leads, it’s important to remember it’s largely a passive ad unit, so it may not incite effort yet on the part of the watcher. That doesn’t mean it isn’t useful, though!
You can view important stats about your video that will tell you if you’re on the right track with things like content and length.
Beyond just seeing the total percentage of the video viewed, you can also see the population broken into the percentage of the video watched to see where the fall-off is:

Based on how long your video is, these stats can help you see if maybe you need to shorten (or even lengthen) your creative.
It’s also really helpful for creating video engagement audiences to show remarketing ads to.
If you’re thinking of making an audience of users who watched 25 percent of your videos, you can check out these metrics to see which ones would have audience sizes at the 25 percent mark that would be worthwhile.
In addition, you may want to check out the 3 and 10-second markers. If your 25 percent portion is low, and those two are also, it could indicate you don’t have a strong enough visual hook in the first few seconds of your video to get users to pause and watch:

Conclusion
While there are many other metrics that can be helpful for specific endeavors (such as Messenger goals or App-focused efforts), these are three that apply to almost any campaign type.
Take a look at them today, and you might be surprised what you find!
More Facebook Advertising Resources:
- 4 Awesome Features That Can Improve Your Facebook Ads
- 10 Simple Ideas to Improve Your Tired Facebook Ad Copy
- 6 Hacks That Will Improve Your Facebook Ads
Image Credits
Featured Image: tuthelens / Shutterstock.com
All screenshots taken by Susan Wenograd, March 2018


