Wordfence introduced a new site speed tool. This tool tests site speed from thirteen points around the world and provides useful information on where bottlenecks are happening and why.
What is Fast or Slow
FastOrSlow.com is a free site speed diagnostic tool. It uses Lighthouse to test site speed from thirteen geographic areas, simulating how a browser will download content.
The data provided by Fast or Slow differs from Lighthouse in that it provides real-world data from 13 locations worldwide.
Lighthouse and many other site speed diagnostic tools do not provide simultaneous testing from locations around the world.
Even though the tool is testing from so many locations at once, it is actually remarkably fast.
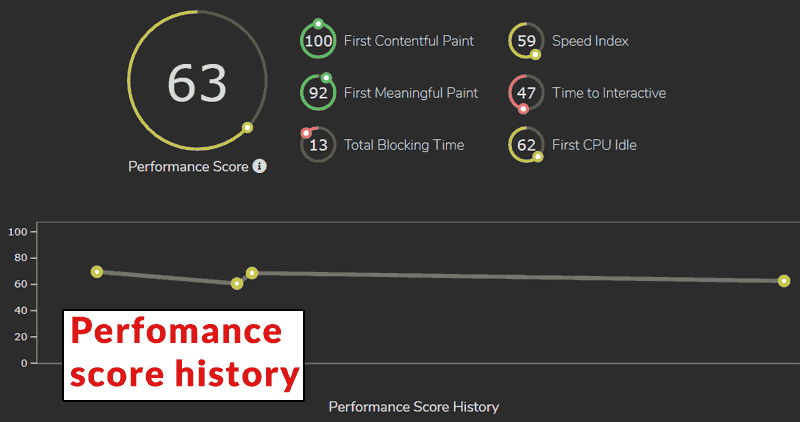
The new tool offers a performance score that is based on First Contentful Paint, First Meaningful Paint, Total Blocking Time, Speed Index, Time to Interactive and First CPU Idle Scores.
But those are just a few of the reports it offers. There is a whole lot more to this tool.
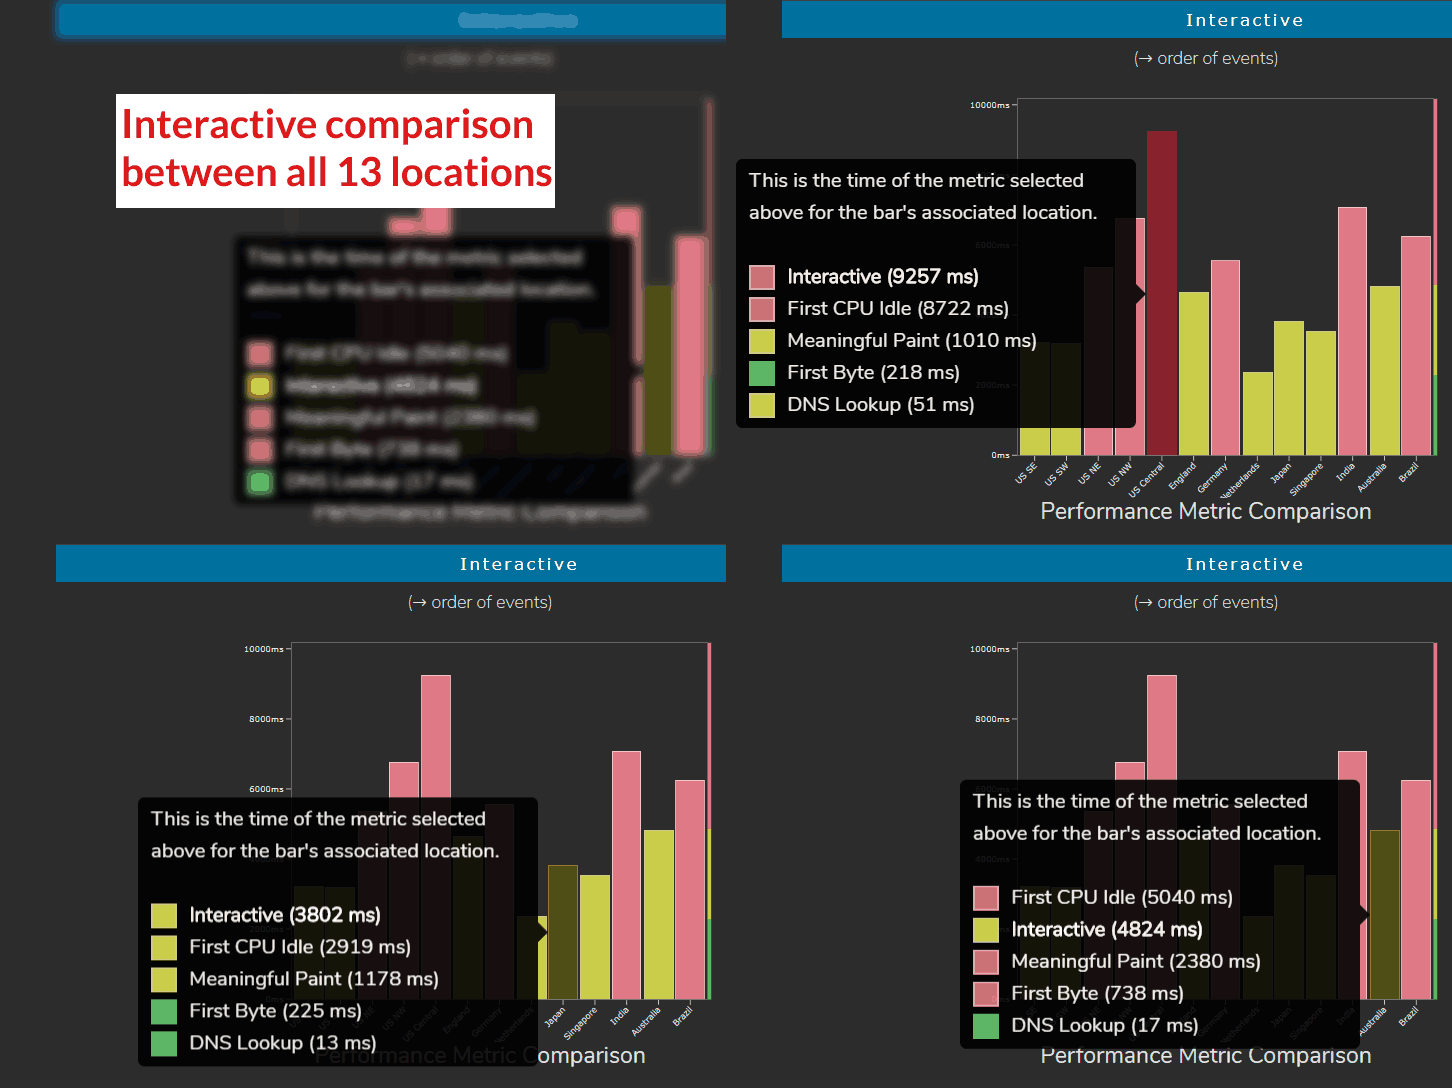
 This interactive summary gives an at a glance review of all thirteen locations. Hovering over one of the tabs reveals more information.
Based on Lighthouse but Different
Although Fast or Slow is based on Lighthouse, the data is different. Here is how Fast or Slow explains the differences:
“…we’re using Google’s Lighthouse to do the actual benchmarking by launching a headless Chrome instance at all 13 locations around the world when we benchmark your site.
However, Lighthouse produces scores that use 2018 industry data from HTTPArchive.
We prefer to use current site performance data to produce comparative speed scoring. So we queried the 2020 data that HTTPArchive provides, and we used that to produce the scores that Fast or Slow gives you from each location for your site.”
The tool could be said to be more accurate.
Chrome Lighthouse uses estimated scores because the Chrome Lighthouse version throttles CPU and network speeds to simulate slower devices.
The Fast or Slow tool is measuring actual speeds.
The Fast or Slow scores more accurately measure real life speeds and are coming from 13 different locations, with actual speed data.
Because the Fast or Slow scores are closer to actual speeds, the data should be different than what may be shown in a local Chrome Lighthouse version.
Free Site Monitoring
Fast or Slow will also allow you to sign up to monitor a site’s performance by email and receive weekly updates on how the site is doing.
This is useful because for monitoring your own or a client’s site. But this tool, in the way it is currently implemented, can also be used to monitor a competitor’s site.
Score Results History

A useful tool is the History of Past Audits. The history of past audits can show you date based trends that can relate to site changes or other factors related to the server. Being able to review a history of past audits can make trends visible to you.
Future Plans for Fast or Slow
I asked the Fast or Slow engineering team if they had plans for downloadable reports and if anything else was on the way:
“Our current roadmap for Fast or Slow continues to focus on providing free and technically robust website performance measurement for the online community.
A downloadable report is certainly something we will discuss internally and if there is clear demand from our customers, we will implement it.
Our focus for the next major release is to provide internal tooling that will allow us to use Fast or Slow to publish comparative research on site performance.
We are interested in monitoring and measuring trends in website performance, and how certain website implementation details impact performance across a statistically significant set of websites.
Once we are satisfied with the quality of these internal features, we will make some of them available to the online community.”
Fast or Slow Measures from Thirteen Locations
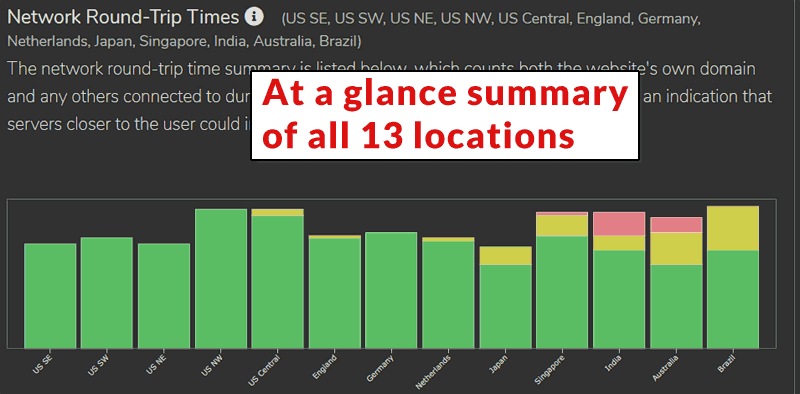
Fast or Slow measures from 13 locations simultaneously. It offers a summary visualization of each location which can be helpful to determining if there are any data bottlenecks in any region or country.
The 13 location summary offers an at a glance visualization:

These are the thirteen locations and IP addresses that Fast or Slow tests from:
- US Southeast – 45.77.163.241
- US Southwest – 104.207.154.109
- US Northeast – 66.228.32.63
- US Northwest -108.61.195.250
- US Central – 45.79.45.44
- England – 136.244.69.8
- Germany – 172.105.89.223
- Japan – 172.105.213.76
- Singapore – 139.180.135.241
- India – 172.105.63.76
- Australia – 45.63.31.211
- Brazil – 18.230.51.106
- Netherlands – 45.76.37.26
Fast or Slow is a Useful Diagnostic Tool
I’ve only touched on a few of the features offered by Fast or Slow. There is so much about it that is useful.
For example:
- You can scroll through the report summary and choose to zoom in on any of the 13 locations to see granular data for that specific region. Then click the Summary icon in the navigation panel to zoom out and return to the summary.
- You can click on an icon and copy a URL for your report and share it with colleagues and clients.
- The site offers a world map keyed to a color code that corresponds to how fast or slow your web page is served visualized on a world map.
Yes, there are other site speed tools. But this one is fast, offers data from 13 locations across the United States and around the world. It also offers site monitoring capabilities that can also be used to automatically monitor competitors as well as your own sites.
The site is available at:
FastOrSlow.com


![AI Overviews: We Reverse-Engineered Them So You Don't Have To [+ What You Need To Do Next]](https://www.searchenginejournal.com/wp-content/uploads/2025/04/sidebar1x-455.png)