This post was sponsored by DebugBear. The opinions expressed in this article are the sponsor’s own.
Want to make your website fast?
Luckily, many techniques and guides exist to help you speed up your website.
In fact, just in the last year, several new browser features have been released that offer:
- New ways to optimize your website.
- New ways to identify causes of slow performance.
All within your browser.
So, this article looks at these new browser SEO features and how you can use them to pass Google’s Core Web Vitals assessment.
In This Guide
- 1. Why Website Performance Is Key For User Experience & SEO
- 2. Add Instant Navigation With "Speculation Rules"
- 3. Optimize Interaction To Next Paint With The New Long Animation Frames API
- 4. View Core Web Vitals Metrics In The New DevTools Performance Tab
- 5. Analyze Largest Contentful Paint Components
- 6. How To Pass Google’s Core Web Vitals Assessement
Why Website Performance Is Key For User Experience & SEO
Having a fast website will make your users happier and increase conversion rates.
But performance is also a Google ranking factor.
Google has defined three user experience metrics, called the Core Web Vitals:
- Largest Contentful Paint: how quickly does page content appear?
- Cumulative Layout Shift: does content move around after loading?
- Interaction to Next Paint: how responsive is the page to user input?
For each of these metrics there’s a maximum threshold that shouldn’t be exceeded to pass the web vitals assessment.
1. Add Instant Navigation With “Speculation Rules”
New Key Definitions:
When websites are slow to load that’s usually because various resources have to be loaded from the website server. But what if there was a way to achieve instant navigations, where visitors don’t have to wait?
This year Chrome launched a new feature called speculation rules, which can achieve just that. After loading the initial page on a website, other pages can be preloaded in the background. Then, when the visitor clicks on a link, the new page appears instantly.
Best of all, this feature is easy to implement just by adding a <script type="speculationrules"> tag to the website. You can then:
- Automatically pre-render entire pages that the user is likely to visit next
- Preload page content when a user hovers over a link
- Partially preload a page, to balance resource consumption and navigation speed
The next page will then load much more quickly, resulting in a great user experience and a low Largest Contentful Paint score.
2. Optimize Interaction To Next Paint With The New Long Animation Frames API
New Key Definition:
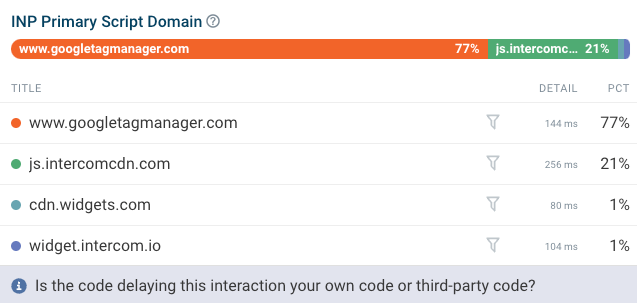
Interaction to Next Paint (INP) became a Core Web Vitals metrics in March 2024. Slow interactions are often caused by JavaScript code running on the page. However, it can often be difficult to identify what interactions are slow, and what scripts are causing delays.
That’s why Google added the Long Animation Frames API to Chrome. It can attribute rendering delays to specific scripts running on your website, telling you what you need to fix to improve your INP score.
Using the API directly is a bit complicated, but you can use Google’s web-vitals.js library or a commercial tool like DebugBear to collect the data.
With the Long Animation Frames feature you can find out:
- What specific scripts are slowing down your website
- Why the code is running (for example in response to a user interaction or due to a background task that’s running on the page)
- How the processing time is spent (for example running code or updating the page layout)
3. View Core Web Vitals Metrics In The New DevTools Performance Tab
New Key Definition:
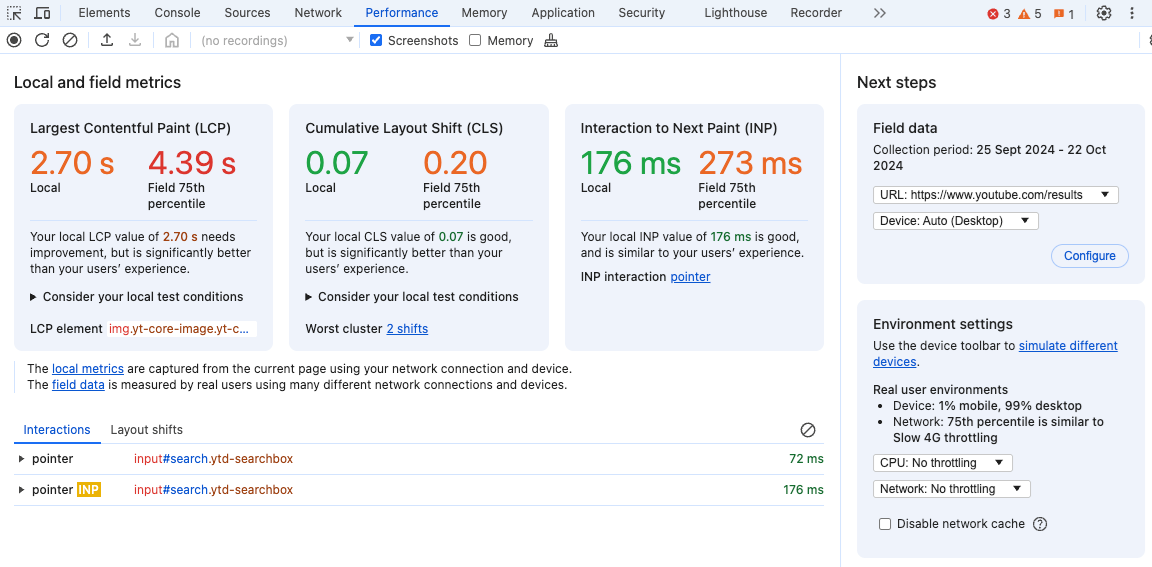
Chrome DevTools has long been a great tool for deep technical performance analysis. However, it didn’t always provide a good high-level overview of your Core Web Vitals data.
That’s changed now with the new DevTools Performance tab. You can now easily see:
- An overview of the Core Web Vitals on the current page
- A list of page interactions and layout shifts
- Real user data from Google’s Chrome User Experience (CrUX) report
The list of user interactions is especially useful for debugging poor INP scores, as you no longer need to record a full performance profile to check how fast an interaction is.
4. Analyze Largest Contentful Paint Components
There are a lot of factors impacting your Largest Contentful Paint score, whether that’s server response time, time spent downloading an image, or waiting for the content to show up.
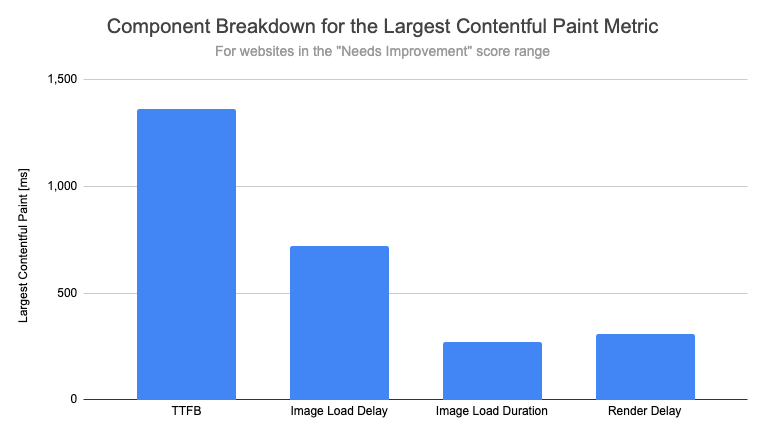
Google has now published a new article explaining which of these components have the biggest impact based on real user data.
Interestingly, while a lot of emphasis has been put on optimizing images to make them load faster, Google found that loading an LCP image actually only accounts for about 10% of the overall LCP metric value. We’re looking at websites with an average LCP rating here, but this finding is consistent with other website categories.
In theory, the main page image can be loaded immediately after the server has provided the HTML document to the browser. But it turns out that there’s often a big delay until the image actually starts loading, as shown by the “Image Load Delay” component which makes up 27% of overall LCP score in the chart above.
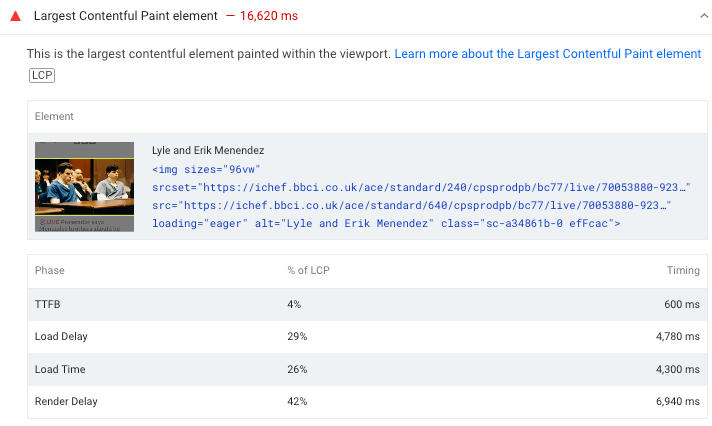
These findings can’t be generalized and applied to any specific website. Instead you can run a Lighthouse test using a tool like PageSpeed Insights. The breakdown can be found under the Largest Contentful Paint Element audit.
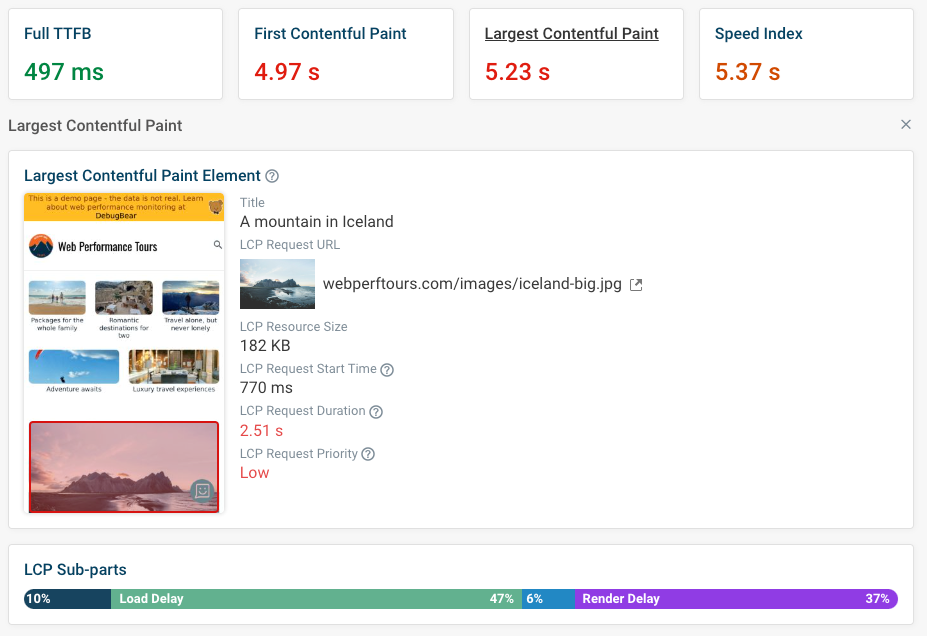
You can also use DebugBear’s free website speed test to view the LCP component breakdown and get more insight into what you can do to optimize the metric.
Click on the Largest Contentful Paint metric to view additional debug data like the image URL, load duration, and request priority.
How To Pass Google’s Core Web Vitals Assessement
In this article we’ve looked at some of the new diagnostic tools you can use to investigate page speed issues on your website, as well as new browser technologies that can help you achieve a faster website.
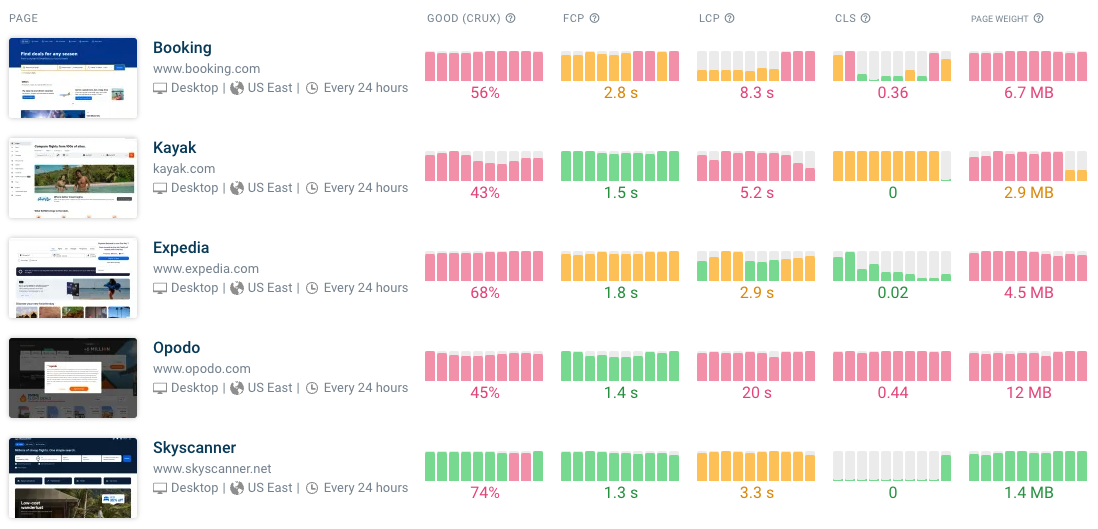
To keep track of your optimizations and stay on top of your Core Web Vitals metrics you can use a website performance monitoring tool like DebugBear. Identify potential optimizations on your own website and benchmark your site against the competition to deliver a best-in-class experience.
Monitoring tools help you spot long-term trends, double-check that the changes you’ve made have a positive impact, and ensure you quickly find out when new problems are introduced.
DebugBear delivers three kinds of page speed data to help you really understand and optimize your page speed:
- Synthetic monitoring: get detailed insight into page load times
- Real user monitoring: actual visitor experiences and optimize Interaction to Next Paint
- CrUX monitoring: track the metrics that impact Google rankings
Start a free trial to see what you can do to deliver the best experiences on your website.
This article has been sponsored by DebugBear, and the views presented herein represent the sponsor’s perspective.
Ready to start optimizing your website? Sign up for DebugBear and get the data you need to deliver great user experiences.
Image Credits
Featured Image: Image by DebugBear. Used with permission.


