Google has been encouraging publishers to increase their web page speed for at least ten years. Google has created resources for helping publishers make their sites faster. Yet a comparison of year over year metrics shows that web pages are getting slower.
There are several page speed metrics. Each metric describes a different part of page speed. Together they relate how fast a site is and what the user experience is on that particular site.
First Contentful Paint
First contentful paint is a metric that measures how long it takes so that a site visitor can see text and images on the web page. It does not describe how soon they can interact with the page, just how soon the page can be seen.
This metric is described by Google’s developers page as a milestone. That’s an appropriate description. A milestone is a marker that marks an event.
What’s important about this metric is that it indicates how soon a user can see the content.
HTTPArchive data shows that the average first contentful paint for mobile at the beginning of 2019 was 6.3 seconds. It took an average of 6.3 seconds for a site visitor to see content while viewing in a mobile device.

By October 1st, 2019, the mobile experience was slower.
The average score for mobile went up by nearly two seconds to 8.0 seconds.
Why Are Mobile Results Slower?
Did Mobile Internet Become Slower?
According to a report by Speedtest.net, a comparison of mobile Internet speed for the first two quarters of 2019 and the same period of 2018 shows that mobile Internet speed actually increased.
- AT&T +45.1%
- Verizon Wireless +9.5%
- T-Mobile +9.4%
Did Mobile Websites Became Slower?
If the major mobile Internet service providers have increased speeds then that may indicate that mobile web pages became slower.
According to Google’s developer page, things like render blocking external stylesheets and scripts and other factors related to minizing file sizes can impact the First Contentful Paint metric.
This is what the developers page says: https://developers.google.com/web/tools/lighthouse/audits/first-contentful-paint
- “Minimize the number of render-blocking external stylesheets and scripts upon which the page depends. See Render-Blocking CSS and Loading Third-Party JavaScript.
- Use HTTP Caching to speed up repeat visits.
- Minify and compress text-based assets to speed up their download time. See Optimizing Encoding and Transfer Size of Text-Based Assets.
- Optimize JavaScript bootup and reduce JavaScript payloads with tree shaking or code splitting. The goal is to do less JavaScript work on page load.”
Time to Interactive is Stable but Poor
Time to interactive is a metric that measures how long it takes for a web page to become interactive, where a user can click around an interact with it. Google’s developer page about this metric recommends deferring or removing unnecessary JavaScript, as JavaScript can impact this metric.
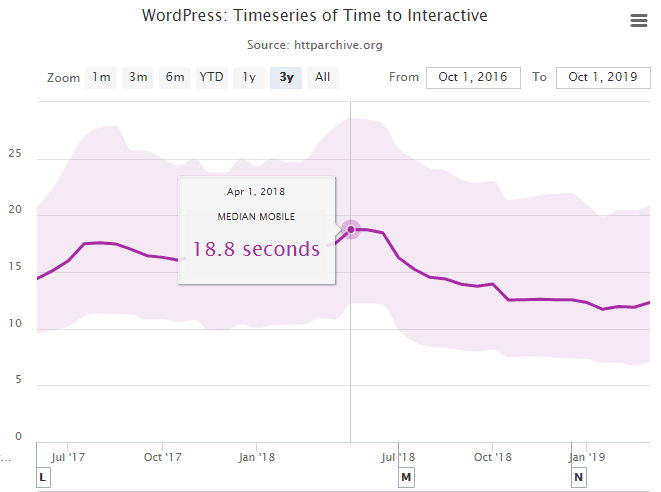
The archive statistics from January 2019 to May 2019 show that the time to interactive metric has stabilized at 12.3 seconds.
It’s great that this metric has not gotten worse. But it’s disappointing that it has not improved. Twelve seconds is an eternity on the web and represents a poor user experience that can impact revenue whether it’s from ad impressions, affiliate sales or actual product sales or leads.
The desktop metrics experienced a modest increase from 2.7 seconds to 3.3 seconds.

Time to interactive has shown great improvement from last year. In April 2018 the time to interactive metric reached a high of 18.8 seconds.
DOMContentLoaded
This is a metric that measures how long it takes for the HTML document to load, excluding stylesheets and images. This is what the Mozilla documentation states:
“The DOMContentLoaded event fires when the initial HTML document has been completely loaded and parsed, without waiting for stylesheets, images, and subframes to finish loading.”
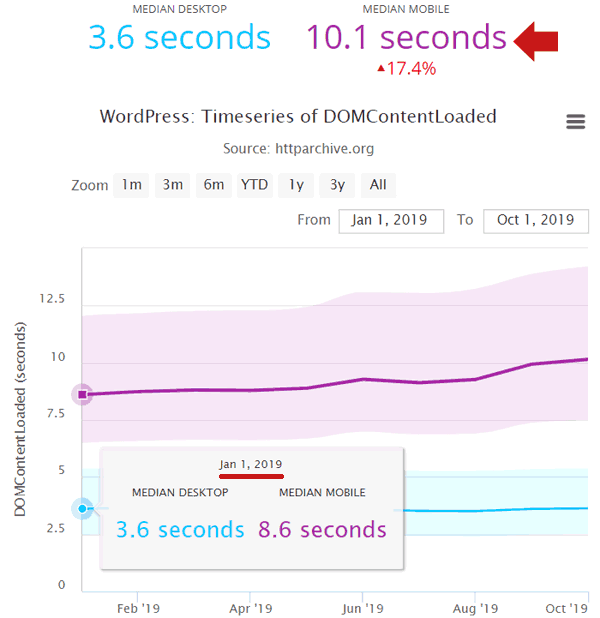
According to HTTPArchive, this metric worsened by nearly two seconds. It went from 8.6 seconds in mobile to 10.1 seconds.
Read more:
https://developer.mozilla.org/en-US/docs/Web/API/Window/DOMContentLoaded_event
Slow Page Speed for Drupal
This isn’t just a WordPress issue, this is seen in websites created with Drupal, too.
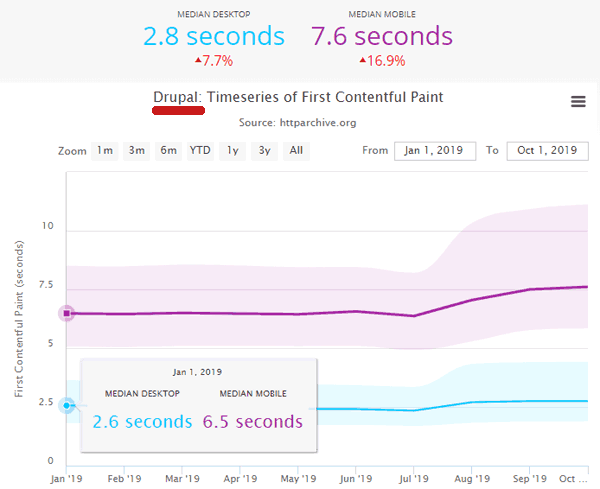
This appears to be an industry wide trend, which indicates it’s not necessarily due to the content management system but something else, like ad tracking and advertising scripts.
One would think that because of the increase in use of Content Delivery Networks and all the advantageous they promise that page speed would be improving but that’s not the case.
Google Losing Page Speed Battle
Google has been urging web publishers to increase speed for many years. Google has used the carrot of a (very small) ranking boost to encourage publishers to improve page speed but for whatever reason publishers appear to not be listening.
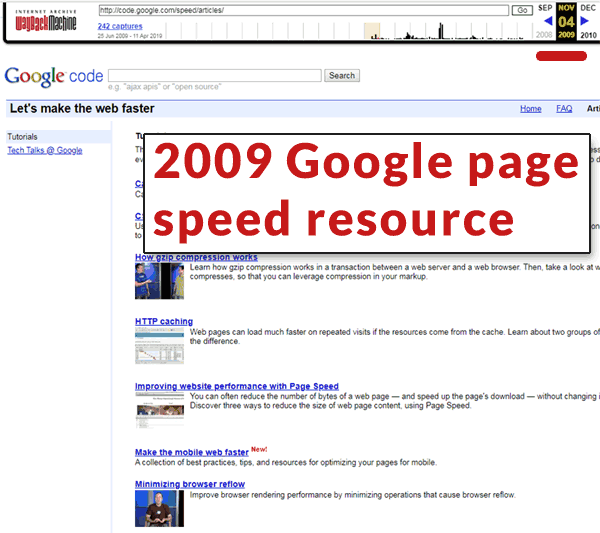
This is the Archive.org snapshot of a resource page from 2009 dedicated to encouraging web publishers to increase web page downloads. But after ten years, while the Internet has made some progress, by many measures the web is still becoming slower.
Publishers are the Biggest Losers
The SEO community is aware of Page Speed, probably because it’s a (very small) ranking factor and because of the well known benefits such as increased revenue.
But for some reason, page speed keeps increasing. One would think that the carrot of higher conversions would be enough. But it’s not. The takeaway here is that there may be an opportunity to take advantage of slow competitor speeds by besting them with a faster website.
It may help increase sales and brand loyalty and all the rewards that come with that.
The takeaway is that while Google is losing the battle for increasing the speed of the Internet, it’s the web publishers who are losing the revenue war by not trying hard enough to focus on page speed.

