If you haven’t heard, Looker Studio has replaced the well-known Google Data Studio brand.
While Google Data Studio made reporting easier for many marketers, it certainly had its limitations.
As a brand’s marketing strategy evolves and becomes more complex, so does the sophistication of its reporting needs.
If you’re anything like me, you’re likely tired of spending hours updating the same spreadsheets each month.
Sometimes, more time is spent pulling a report than providing actual insights.
When this happens, we’re doing a disservice by spending more time “doing” and less time actually analyzing the data.
There has to be a better way, right?
This in-depth Looker Studio guide will teach you how to create and customize action-oriented reports based on your own data.
What Happened To Google Data Studio?
Originally introduced in beta mid-2016, Google Data Studio is a free data visualization tool.
Many marketers have used this tool for years to unify and visualize data sets from multiple channels.
But now, you’ll notice that Data Studio is no longer referenced. Where did it go?
Google officially rebranded its Data Studio product to be named Looker Studio in October 2022.
In their official announcement, Google stated:
“We are unifying our business intelligence product family under the Looker umbrella, bringing together Looker, Data Studio, and core Google technologies like artificial intelligence (AI) and machine learning (ML). Looker Studio is still free, and has the same features as Data Studio.”
What Is Google Looker Studio?
Google Looker Studio (formerly Data Studio) syncs all of your data sources into one unified reporting experience.
It enables users to create informative and visual dashboards that are easy to interpret, share, and customize.
Essentially, Looker Studio helps go beyond data visualization. It’s aimed to help marketers make more data-driven decisions for their clients and brands alike.
Currently, Looker Studio supports over 800 different data sources, along with 600+ data connectors.
Looker Studio Vs. Data Studio
While Looker Studio touts many of the same features as the former Data Studio, the new name also brings new features.
- Free version and Pro version (paid).
- Different modeling method (LookML).
- Looker integration with Google Sheets.
- More flexible data modeling features.
- Supports 50+ SQLs and databases.
- Merging features from different data sources.
One of the key differences between Looker and Data Studio is the way data is modeled. Looker Studio uses LookML (Looker Modeling Language).
The second key difference that most marketers will benefit from is the new and improved data merging features from Looker.
In Data Studio, it allowed for data sources to be blended.
However, the biggest downside of this was that the blending feature was based on a left outer join and often didn’t blend data in a way that marketers needed.
It was a tedious process that left many to spend more time manually importing their data into a Google Sheet, then connecting that source to Data Studio.
Sounds frustrating, right?
Looker Studio, on the other hand, requires SQL databases to integrate any source. This means that raw data is passed into a database, making it much easier for Looker to merge data from different sources.
The result? A faster, more meaningful way to visualize data from all your different marketing sources in an easy-to-digest format.
Getting Started With Looker Studio
There are a few key areas to ensure your first Google Looker Studio report is a success. These include:
- Choosing a template or dashboard.
- Connecting data sources.
- Choosing metrics that matter.
- Sharing reports.
Looker Studio Templates
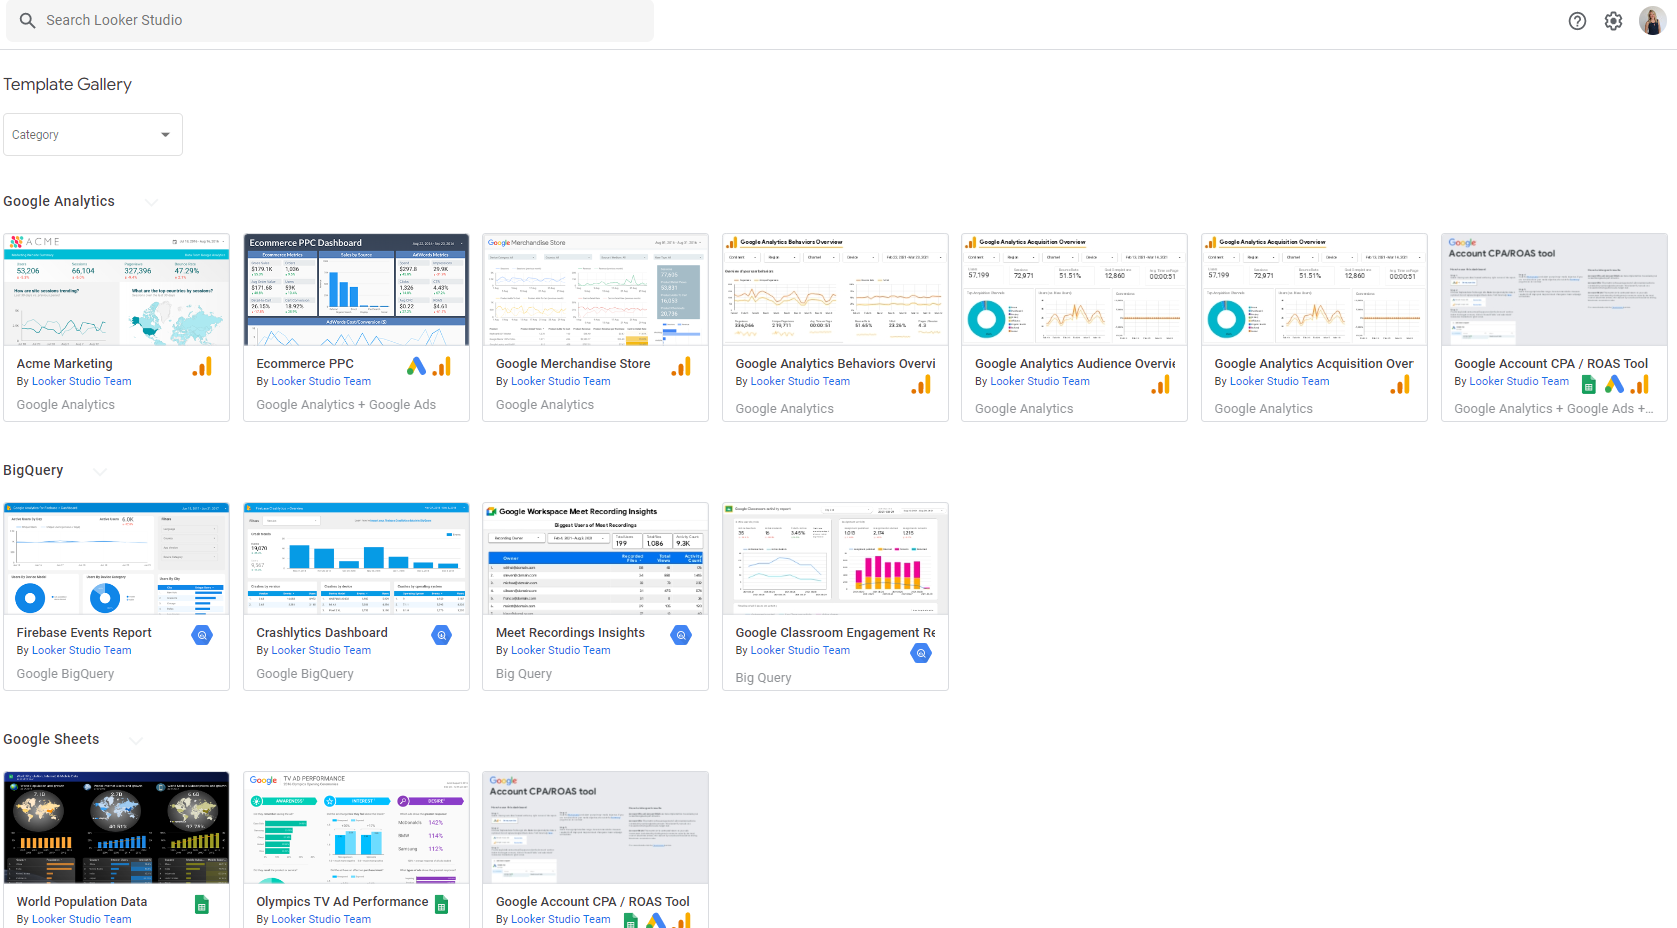
The first thing to do is to choose a template.
To access Looker Studio, visit Looker Studio using your preferred Google Account. This should be the account that you access your Google Analytics, Search Console, Google Ads, etc.
Looker Studio provides a wide variety of templates to get you started.
If you’re new to Looker Studio, it is important to choose a template based on the type of data being portrayed.
 Screenshot from Looker Studio, December 2022
With any template, you have the ability to customize items and fonts to create a more consistent report.
The beauty of these reports is that multiple pages can be added.
Don’t feel like your entire marketing story needs to be shown on one page!
Every client has different needs, and their reporting should be no different.
The most efficient route I have found is to use and tweak different dashboards based on who the intended audience is.
For example, I may create a different dashboard or report page if I’m talking to a CMO vs. a Product Marketing Manager. Why?
Depending on the role of who you’re talking to, they will understand and interpret data in different ways.
A CMO, for example, doesn’t need to know the “in the weeds” data. They want to know what channels are working, what’s not, and if they’re on track to meet their goals.
Connect A Data Source
Now that you’ve selected a template, it’s time to connect your data sources.
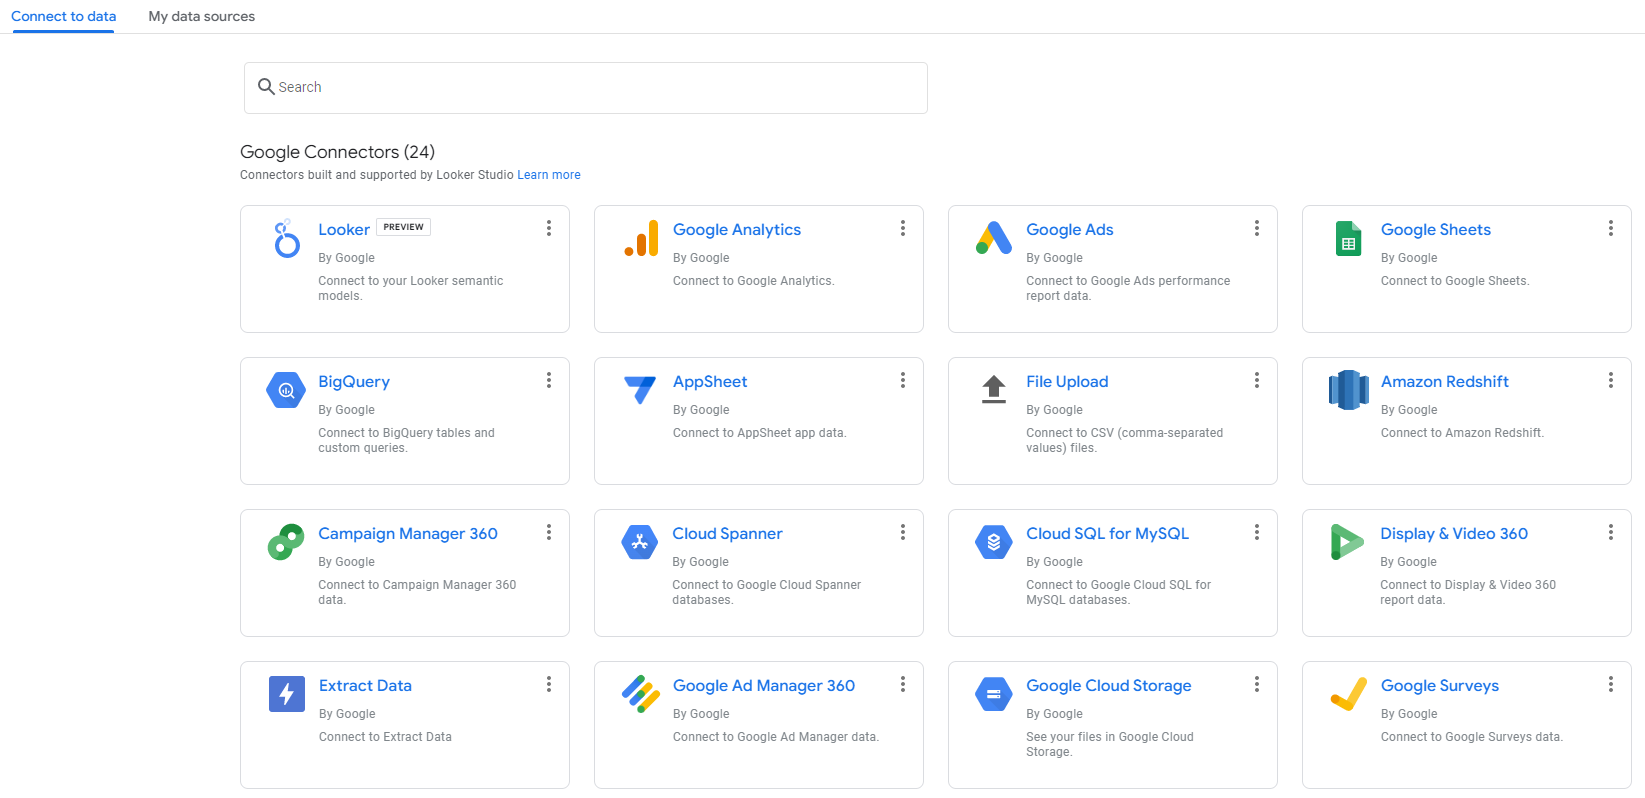
To add a connector to your template, go to Resource at the top navigation, then click Manage added data sources. Then, you’ll click + Add A Data Source.
 Screenshot from Looker Studio, December 2022
There are currently 24 different Google connectors, such as Google Analytics, Google Ads, Google Sheets, BigQuery, and more.
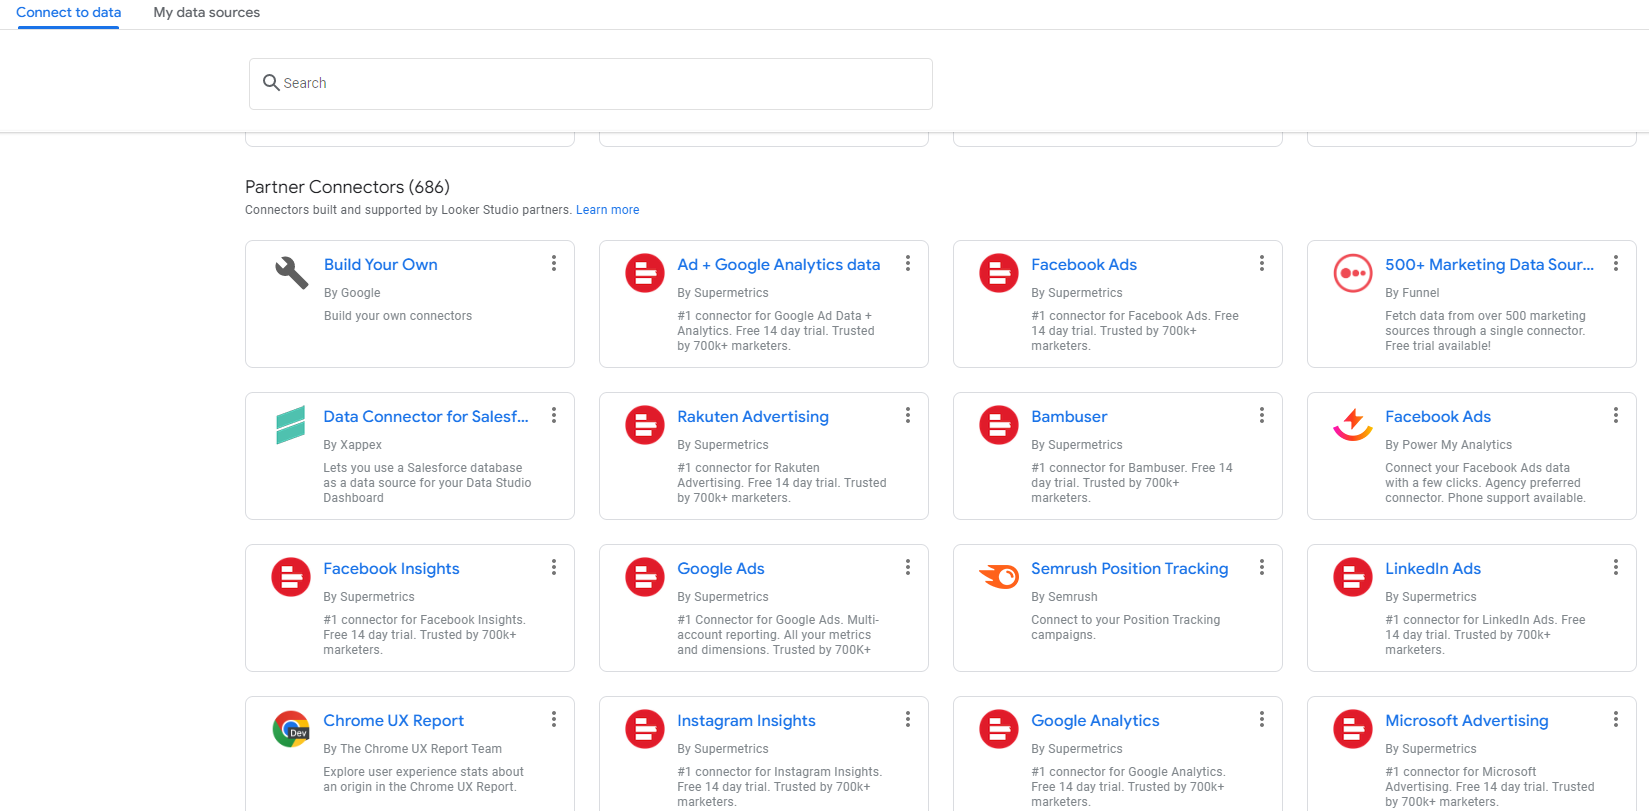
However, you’re likely using other platforms like social media, third-party tools, CRM systems, and more.
For those non-Google connectors, Looker Studio can connect over 650 different data sources from their partner connectors!
 Screenshot from Looker Studio, December 2022
By using the connectors, it takes the manual tasks and syncs all data for you!
It’d be impossible to list all the available data sources here, but some of the main ones I’ve used in the past include:
- Supermetrics connectors for:
- Facebook + Instagram Insights.
- Microsoft Advertising.
- Ad + Google Analytics Data.
- Position Tracking.
- And many more.
- SEOMonitor.
- CallRail.
- Salesforce.
- HubSpot.
Most of these data sources come from third-party connectors. Keep in mind that many of them:
- Additional cost.
- Can slow down reports.
- Metrics are sometimes deprecated, meaning it is vital to stay on top of any changes to your report and rebuild metrics if needed.
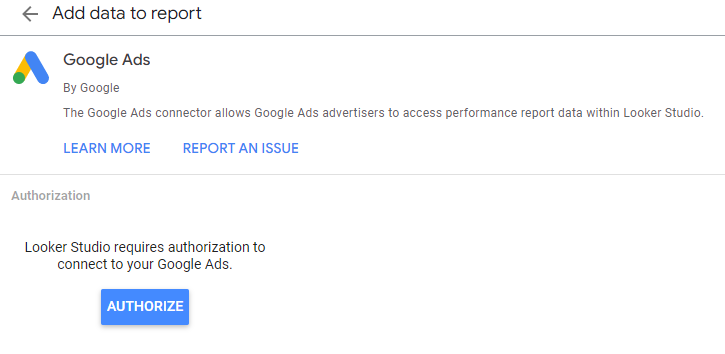
When adding a data source, you’ll be asked to authorize the connection between accounts.
Choosing Metrics That Matter
Speaking of metrics – they matter.
Let’s be real, the worst is when clients open reports and see a complete data dump.
While Looker Studio is completely customizable, this does not mean we should be showing all metrics available.
Does your client care about return on advertising spend (ROAS)? Be sure to include metrics such as spend and revenue.
How about overall brand awareness? Include pre-click metrics such as impressions, clicks, CTR, view rate, etc.
By conveying the proper metrics and insights based on goals, it shows the client that you are listening to them. A win-win for everyone!
How To Edit A Report
Now that you’ve connected your data sources, it’s time to customize that report!
Let’s review this Google Ads template as an example.
First, you’ll want to make sure you’re in the “Edit” mode and not “View.”
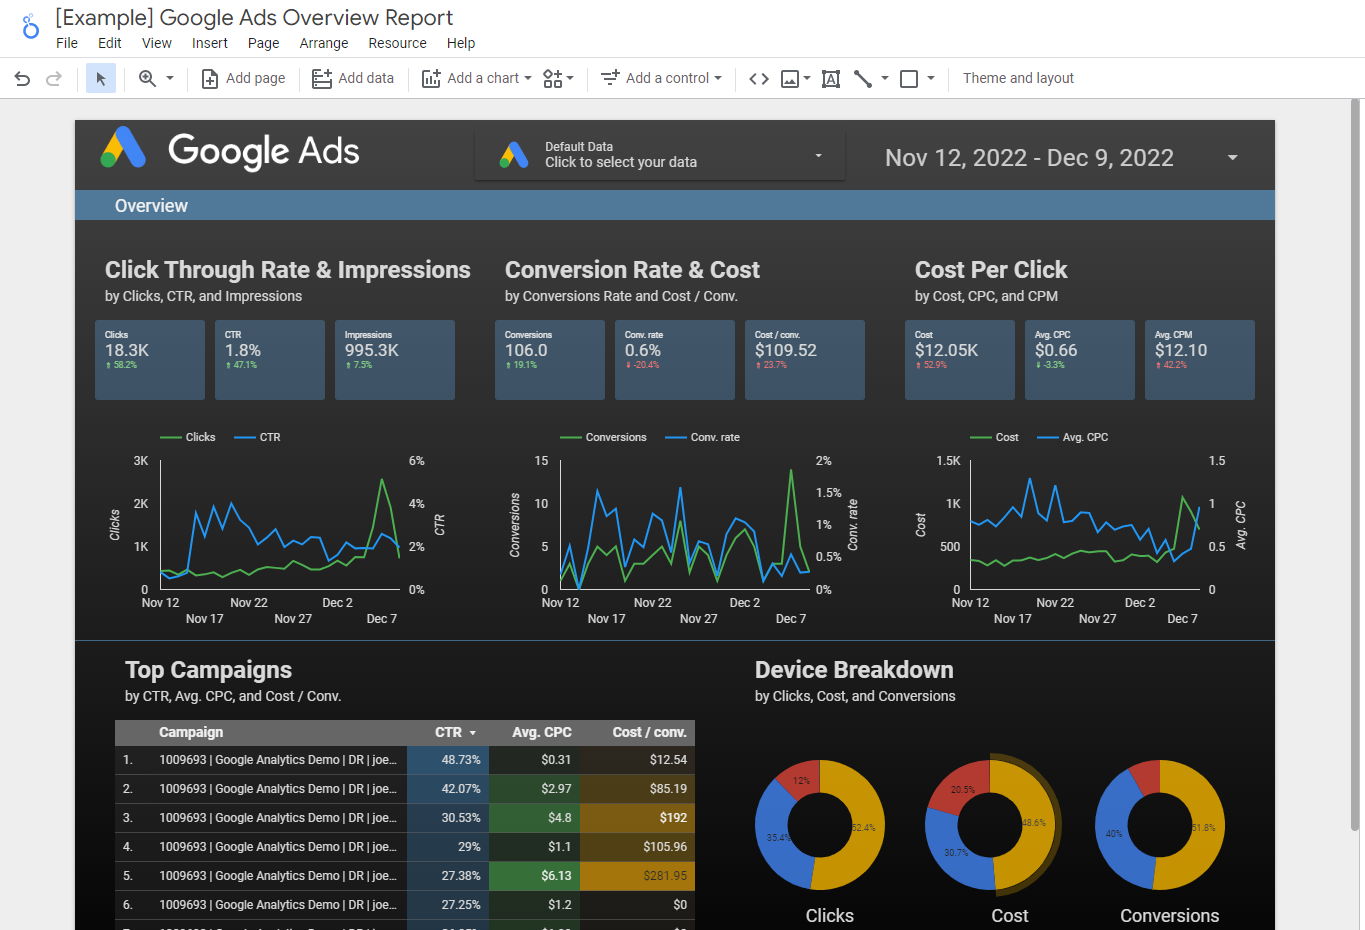 Screenshot from Google Ads, December 2022
You can start customizing your report by utilizing the data field sets on the right-hand side.
If you’ve chosen a template like the one above, the first step is to change the data source for each chart you wish to choose.
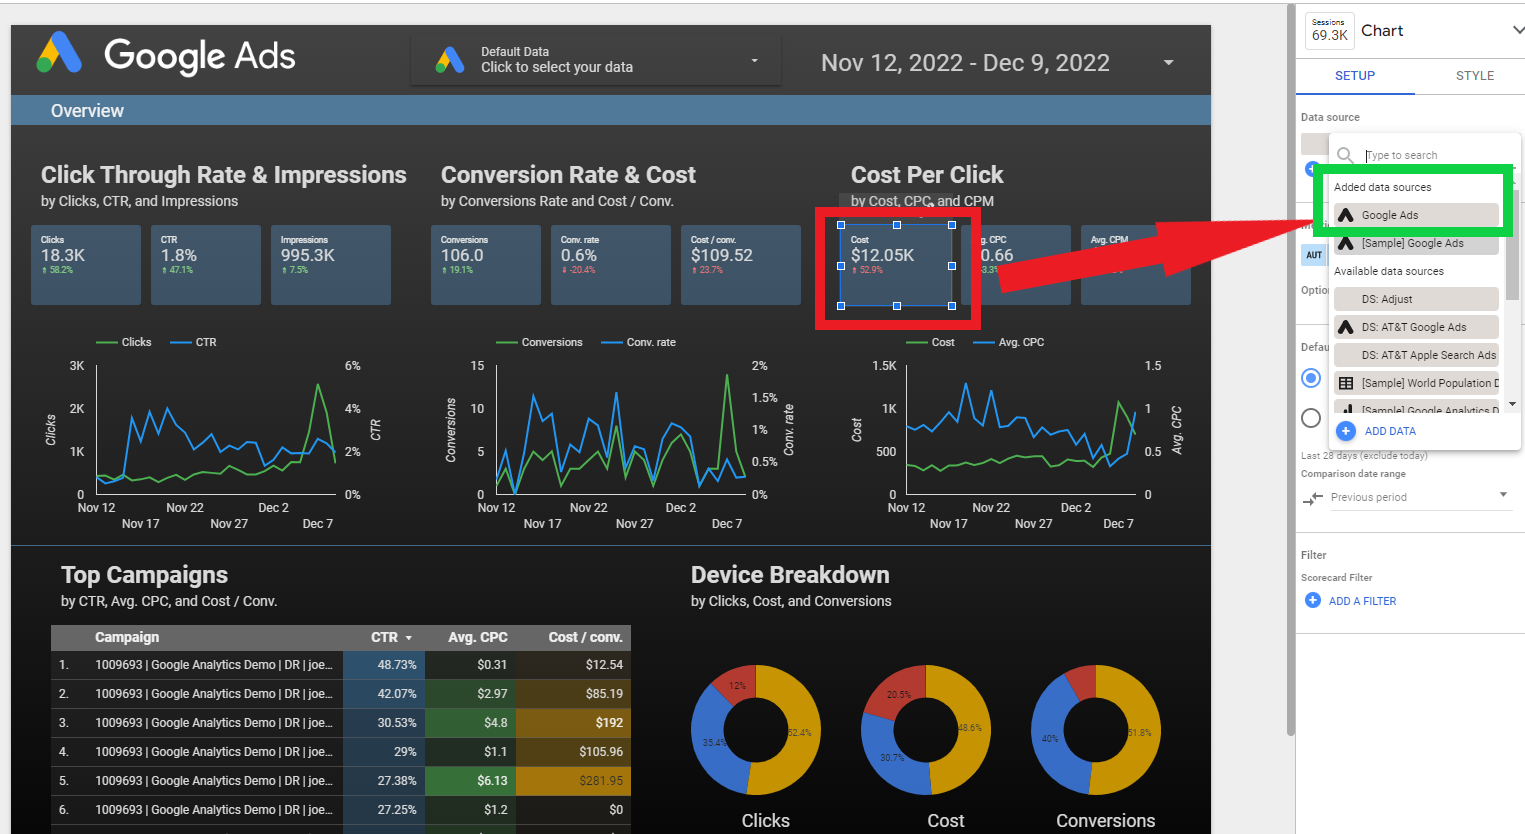 Screenshot from Google Ads, December 2022
From there, you can choose from any of the different data fields from your chosen data source to change any visualization.
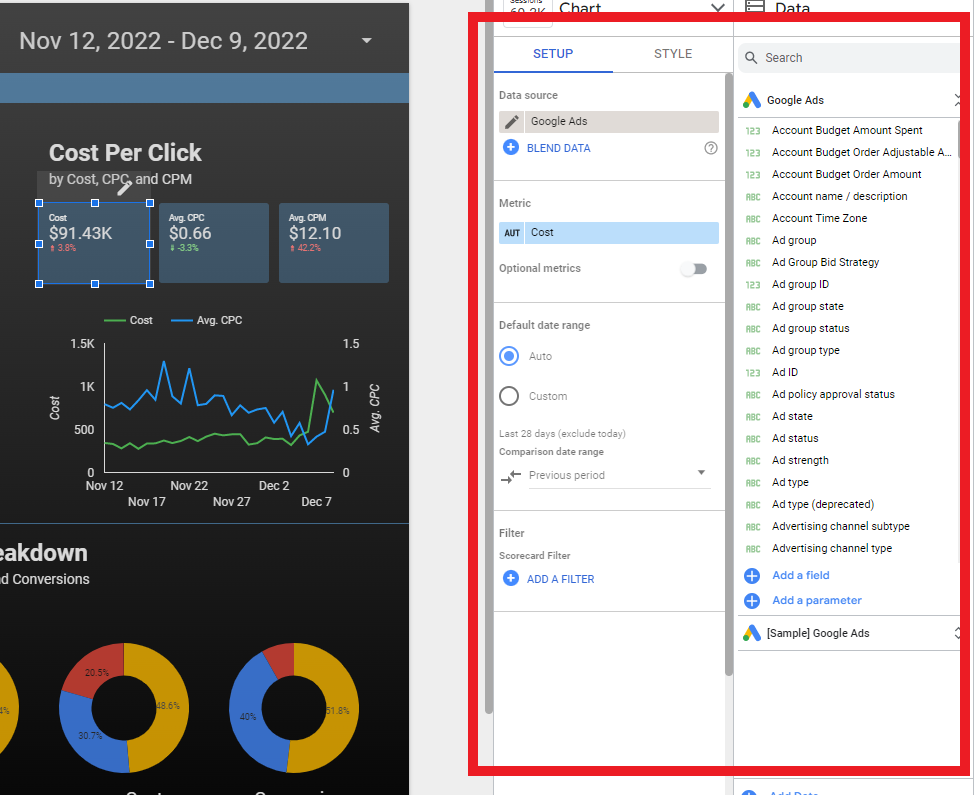
Not only can you create and edit charts and tables in Looker Studio, but the ability to choose the look and feel of a report is a game-changer for clients.
It gives a sense of consistency across an organization.
A few ways to personalize the style of your report include:
- Font and background color.
- Changing comparison metric colors.
- Text padding to align either left, center, or right.
Pro tip: If you want to change all scorecards or charts at once, simply select all at the same time before.
The style changes will apply to all selections. Another time-saver!
In this example, I changed the report background, scorecard colors, and label fonts to create brand standard consistency:

If you’re new to Looker Studio, it will take time, trial and error, and patience to create a report visual that meets your reader’s expectations. Don’t get discouraged along the way!
Adding Report Filters
An efficient way to group multiple visualizations together is by adding report and page filters.
For example, if you wanted all tables and charts to change when editing the date range, you could add a Date Range icon and set it to “Report Level.”
This means that if the report is comprised of multiple pages, whenever the date range is updated, all chart data updates alongside it.
For example, if you wanted to dive into Campaign Type performance, there’s a filter for that!
Simply navigate to the toolbar and choose Add a control > Drop-down list and add the Control field of “Campaign type” as your filter.
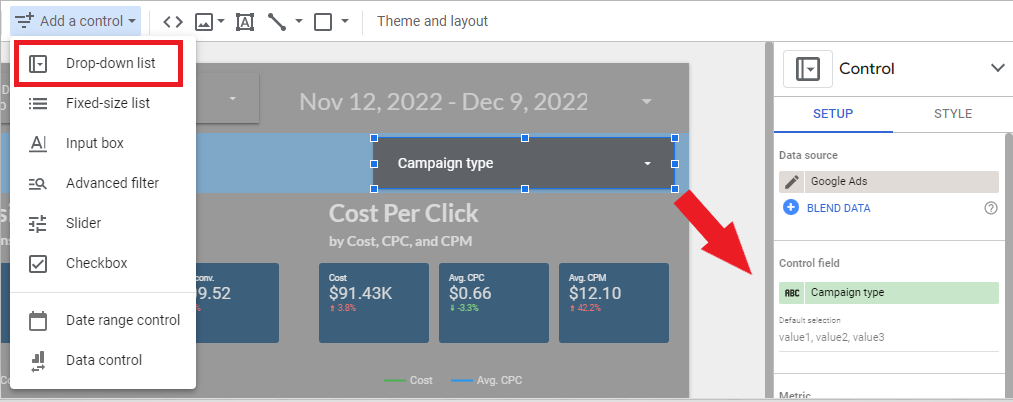
This allows you to filter the data on that particular page by campaign type.
For example, if you wanted to show how Search performs compared to YouTube, you’d choose from the dropdown in that filter.
By default, filters added are at a page level.
If you wish to make the filter report-level (meaning the filter would appear on each page of your report), simply right-click the filter and choose Make report-level.
Create A Chart
If you’ve gotten comfortable with your Looker Studio experience, let’s dive into how to create a chart from scratch.
The advantage of creating a custom chart is that you’re in full control from the beginning of visualizing exactly what matters most.
The first step is to consider who will be reading this report. Remember to include what data is important to them.
Your chart should tell a story, and it’s up to you to visualize that successfully.
For example, you may want to add an “Overview” table that encompasses the main metrics or key performance indicators (KPIs) that matter to them.
To create a chart, click on “Insert,” which will show you all the different charts to choose from. These include:
- Time series.
- Bar chart.
- Pie chart.
- Tables.
- Scorecards.
- Bullet charts.
- Much more.
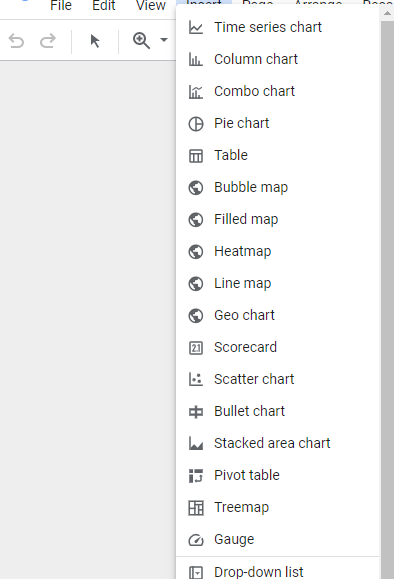
In this example, I want to choose a simple bullet chart to add to my CMO Overview page. The goal of this chart is to show if we met our monthly goal of app installs.
The first step is to choose the metric you’re measuring. In this case, I chose “Installs.”
To make this bullet chart effective, you need to add your target/goal. Make sure to check the box that says “Show Target.”
Then, I input different range limits to show the progress.
I kept the last range the same as the target value. You can also put the last range as a higher value than your target, especially if you exceed that target value.
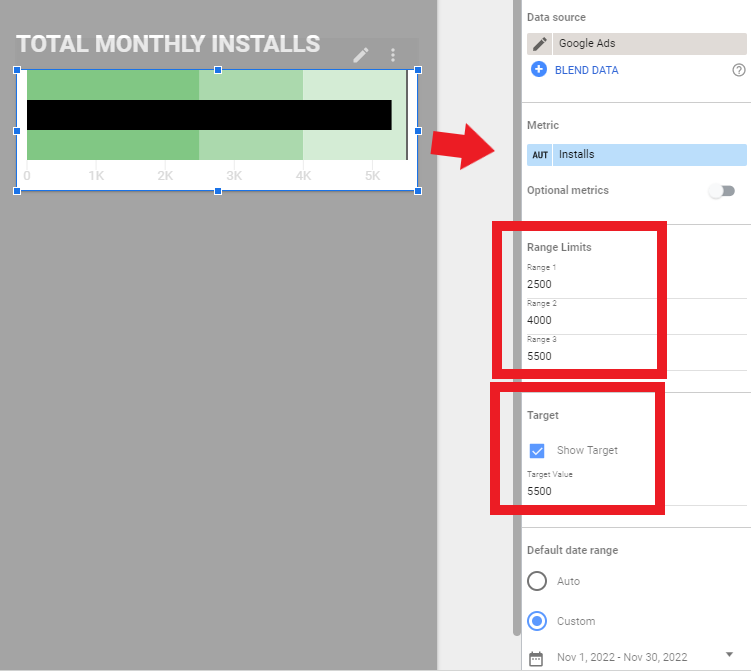
So, what does this chart say? It portrays that our goal was 5,500 app installs for the month of November.
According to the bullet chart, they were close to hitting their goal but didn’t quite make it.
Sometimes simple charts are all you need to represent the necessary data.
Like all other elements of Looker Studio, you can modify the style of any chart, table, or element as I did above.
Sharing Reports
The following options are available for sharing a Looker Studio report:
- Invite people.
- Schedule email delivery.
- Get report link.
- Embed report.
- Download report.
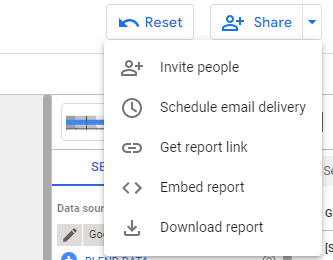
If you want to invite people to access the report in real time, it’s important to check the share settings.
To add someone via email, it must be a Google account email. They can be added as a “Viewer” or an “Editor.”
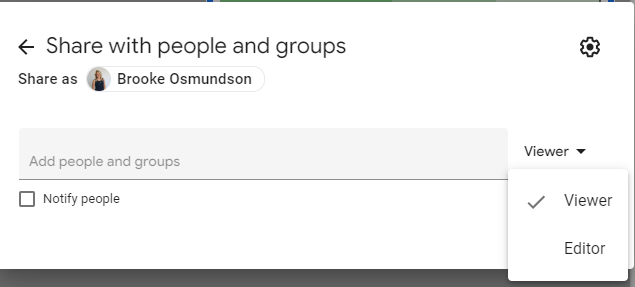
Another data safety measure Looker Studio added was how links to the report can be shared.
You can choose from:
- Restricted. Only people who you have shared the report with can open the link.
- Unlisted. Anyone on the internet with the link can view (or edit – choose this setting carefully).
- Public. Anyone on the internet with the link can find and view (or edit – choose this setting carefully).
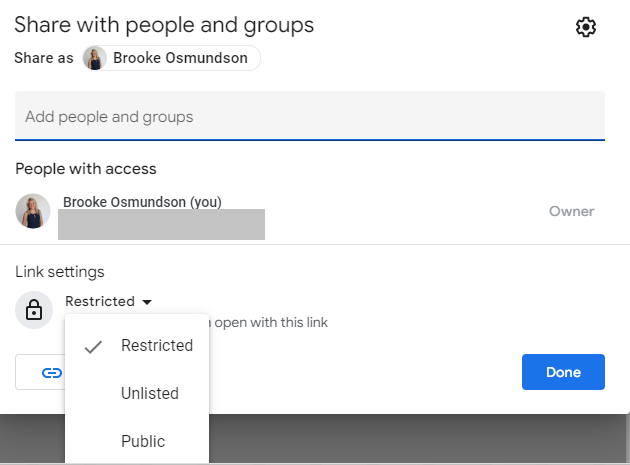
Another cool feature Google added is the option to limit sharing in the following options. In the share settings, click on the “gear” icon in the right-hand corner:
- Prevent editors from changing access and adding new people.
- Disable downloading, printing, and copying for viewers.

I typically recommend checking the first box to prevent editors from changing access or adding new people.
By doing so, it allows us to maintain control of the report settings and the integrity of report changes.
Get Started With Looker Studio Now
Hopefully, this introduction to Google Looker Studio will empower you to feel more confident in creating personalized reports for your clients and brands.
More Resources:
- The Ultimate Google Ads Pacing Dashboard For 2023 (Free Looker Studio Template)
- The 40 Best Google Tools For Productivity And Marketing
- PPC Trends 2023
Featured Image: RomanR/Shutterstock


![AI Overviews: We Reverse-Engineered Them So You Don't Have To [+ What You Need To Do Next]](https://www.searchenginejournal.com/wp-content/uploads/2025/04/sidebar1x-455.png)