Google’s PageSpeed Insights added two new metrics to the PageSpeed Insights API and UI for Lighthouse. The two metrics are labeled experimental are now being collected for field data while the corresponding lab data can be used for diagnostic purposes.
Google Lighthouse Updated
Lighthouse is now updated with the two new metrics.
The new Lighthouse metrics are:
- Interaction to Next Paint (INP)
- Time to First Byte (TTFB)
Time to First Byte (TTFB)
Many people will already know of Time to First Byte, it’s been around for many years and some may already be be familiar with it.
The Time to First Byte (TTFB) metric measures how fast the server responds to a request for a resource.
Thus, the importance of this metric is that it helps to isolate one factor (server responsiveness) which can have a negative effect upon all other page loading metrics that come afterward.
That makes TTFB a very important metric to review for diagnostic purposes.
Anyone focused on improving Core Web Vitals should give TTFB a look for a possible quick win.
What’s changed about TTFB is that this is the first time it is available as a metric in the PageSpeed Insights results section.
Chrome will also collect and report TTFB field data for the first time as well.
Interaction to Next Paint (INP)
Interaction to Next Paint (INP) is a brand new metric that represents how long it takes to interact with the entire page, what Google calls the “overall interaction latency.”
INP measures represents how long it takes to interact with the entire page, which is in contrast with First Input Delay which only measures how long it takes for the page to respond to the first interaction by a site visitor.
Google uses an example of a shopping page to illustrate the difference between a good INP and a poor INP.
The example of a shopping page shows a clickable image that spawns a bigger closeup version.
The example of poor responsiveness is a user clicking the image then waiting for something to happen as the bigger image downloads to the browser. There is no feedback response to the click.
The example of a good responsiveness is of a user clicking the same image which immediately responds with a page-loading graphic that communicates that the request for the image was received and is now loading up.
Screenshot of a Good Responsiveness of a Web Page Element

The above is an example of how the new INP metric will measure the all of the responsive elements of a web page in order to come to a representation of Interaction to Next Paint.
Google’s Web.dev explains the new Interaction to Next Paint (INP) metric:
“INP is a metric that aims to represent a page’s overall interaction latency by selecting one of the single longest interactions that occur when a user visits a page.
For pages with less than 50 interactions in total, INP is the interaction with the worst latency.
For pages with many interactions, INP is most often the 98th percentile of interaction latency.”
New PageSpeed Insights Layout
The two new metrics are available to review right now in the PageSpeed Insights tool.
But it may take some time for the field data to show up because the field data derives from actual Chrome browser users who have opted into allowing the page speed data to be sent to Google to visit the site and have their data recorded.
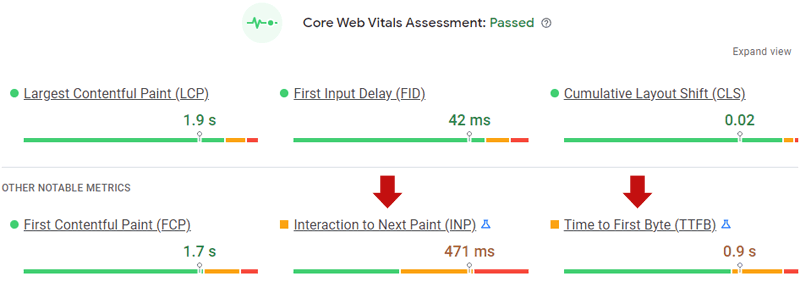
The core web vitals scores are listed first in a row (on the desktop view).
Lighthouse then displays a second row of metrics:
- First Contentful Paint
- INP
- TTFB
Screenshot of New Lighthouse Metrics Display

Chrome Lighthouse Extension
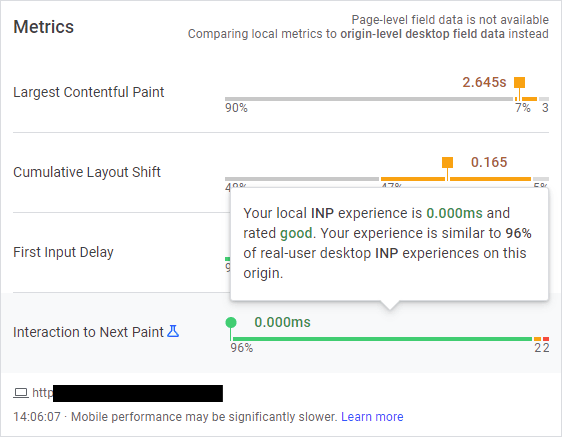
Another way to view the new metrics is with the Chrome Lighthouse extension.
The way to use it is to browse to any page and a square box on the top right side of the browser will turn red or green depending on if the page passes the Core Web Vitals metrics.
Clicking on the box itself activates a display of the CWV and experimental metrics.
Screenshot of Chrome Lighthouse Extension

New Metrics Available in 3rd Party Tools
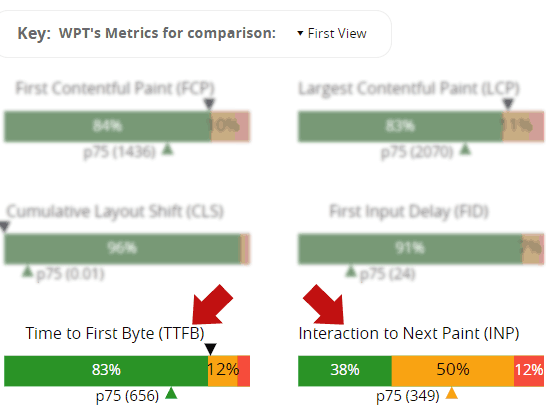
The many page speed tools that use Lighthouse in their analysis will also show the INP and TTFB metrics.
For example, WebPageTest.org now shows the new metrics.
Screenshot of WebPageTest Lighthouse Results

Page Speed Insights Updates
There are also additional updates to the PageSpeed Insights tool.
A noticeable change is the speed at which results are shown, which is accomplished by loading both field and lab data in parallel.
Another change is that PageSpeed Insights will try to resolve HTTP redirects first before sending it off to Lighthouse to perform analysis. Previously Lighthouse would handle the HTTP redirects while performing the analysis.
Plus two more additional changes:
“The Core Web Vitals (CWV) metrics (LCP, FID, CLS) appear directly underneath the CWV assessment.
We tightened the design, reducing verbosity and vertical space.”
Lighthouse Data is More Useful
The addition of these two metrics, TTFB and INP makes all the page speed tools that use Lighthouse analysis significantly more useful. TTFB provides feedback on server-related issues that may underlie poor speed performance elsewhere and INP offers a broader overview of page performance than has previously been available.
Citations
Read Google’s Official INP Explainer
Interaction to Next Paint (INP)
Read Google’s Recently Update TTFB Explainer
Read PageSpeed Insights Release Notes
Release notes for PageSpeed Insights API and PageSpeed Insights UI


![AI Overviews: We Reverse-Engineered Them So You Don't Have To [+ What You Need To Do Next]](https://www.searchenginejournal.com/wp-content/uploads/2025/04/sidebar1x-455.png)