Google’s PageSpeed Insights tool has been upgraded with the ability to measure how fast a page performs in the real world.
Previously, PageSpeed Insights would grade a page based on how many boxes it ticked on a list of best practices. It did not necessarily measure how fast a page loads.
PageSpeed Insights will now pull data from the Chrome User Experience Report, allowing it to deliver more accurate results. Scores will be adjusted based on the new data, and the tool will be able to provide better recommendations.
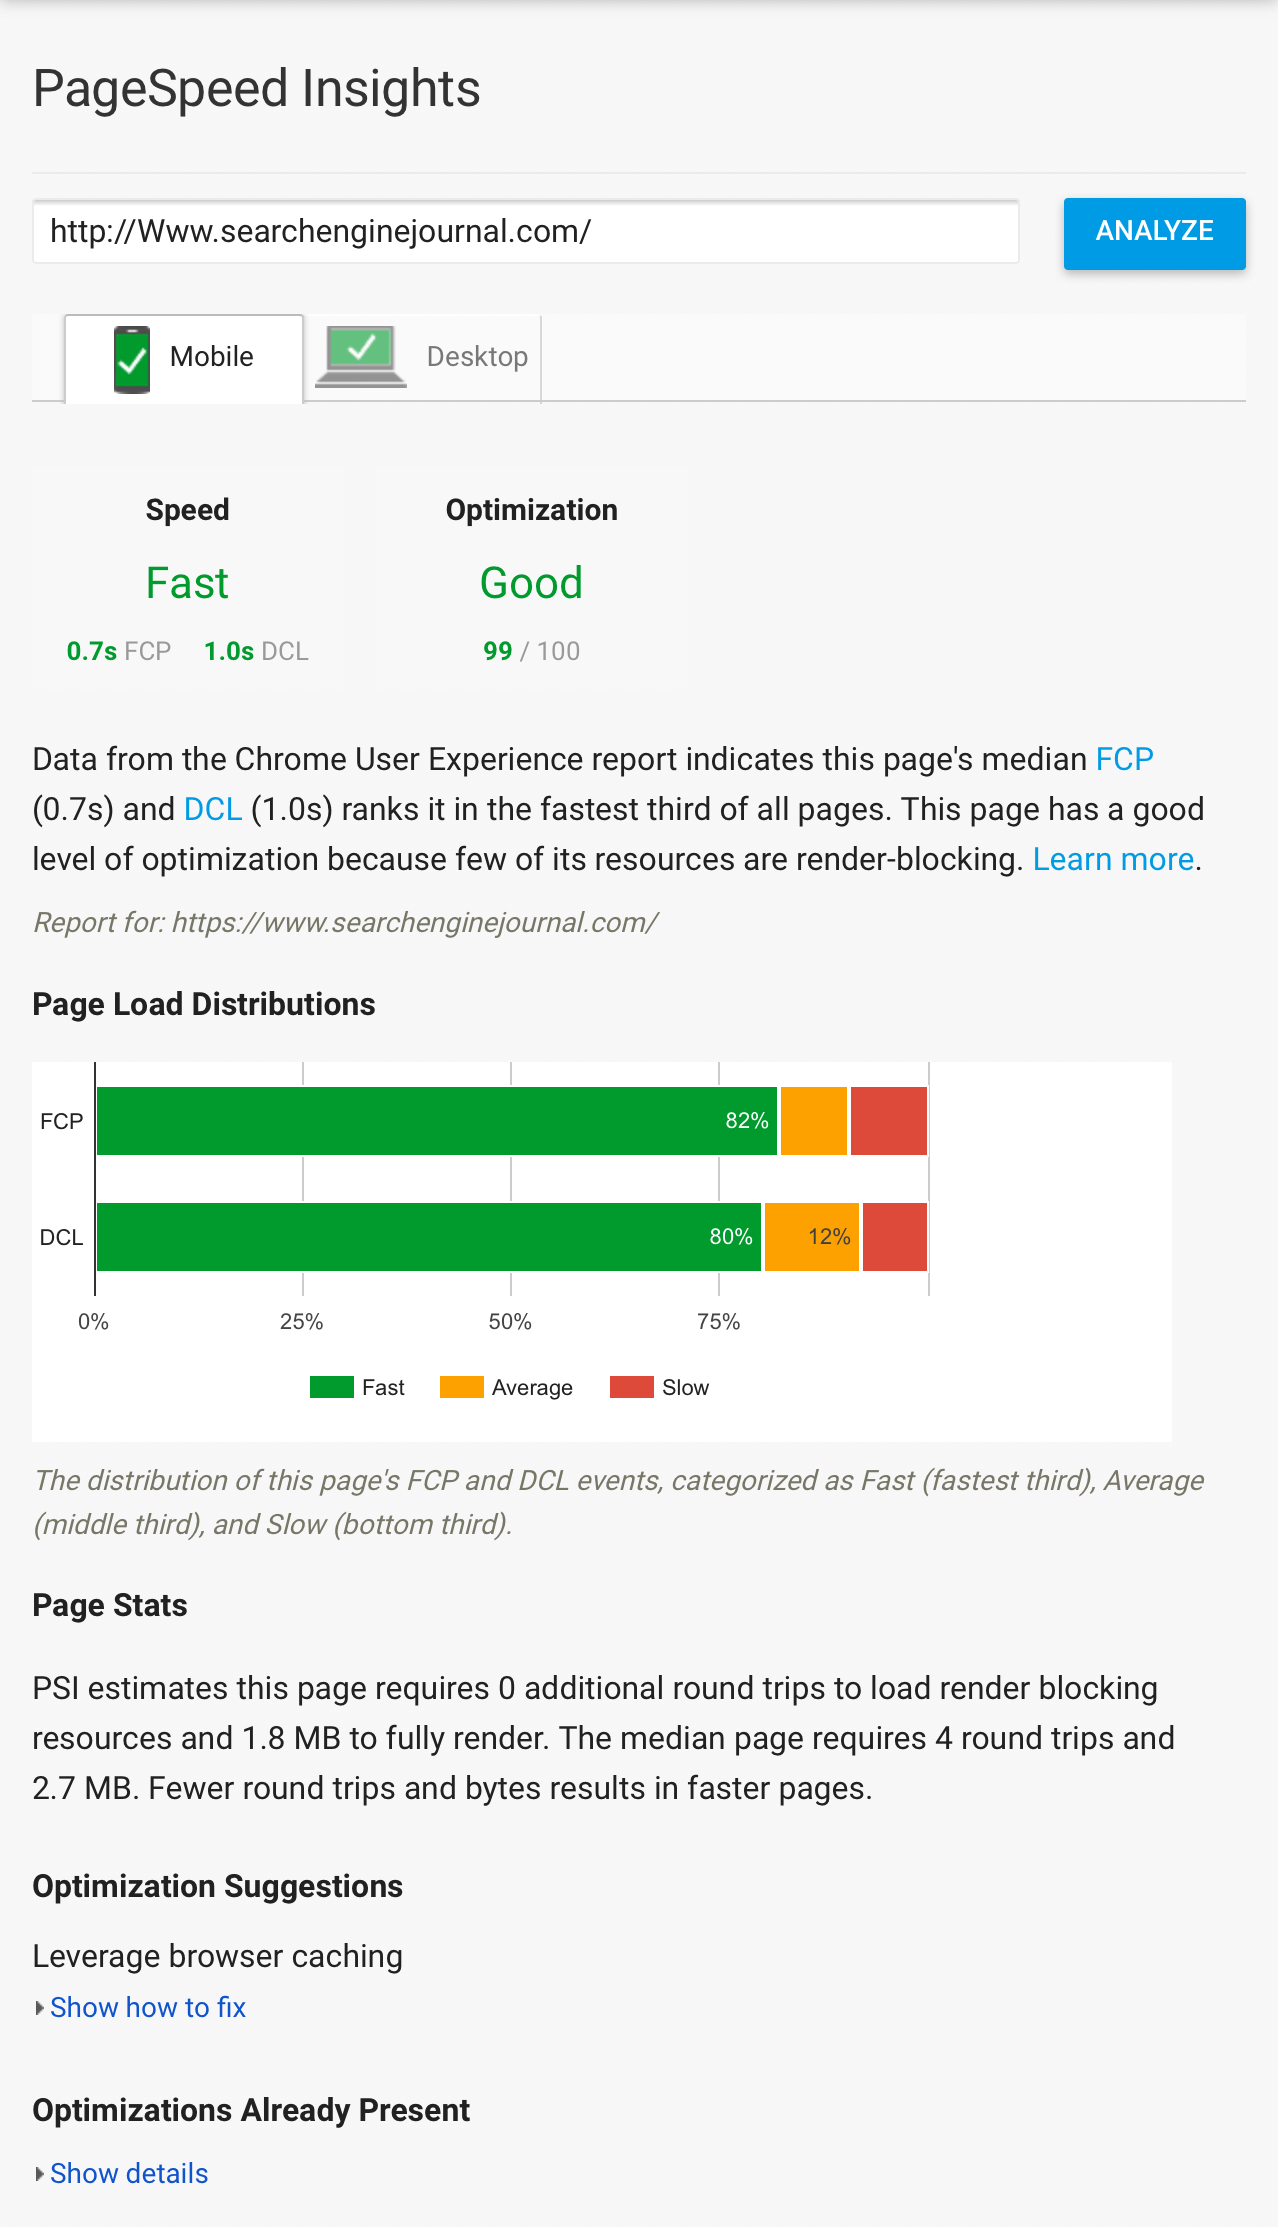
The new PageSpeed Insights report will be broken down by the following categories:
- Speed score: Categorizes a page as being Fast, Average, or Slow.
- Optimization score: Categorizes a page as being Good, Medium, or Low based on performance headroom.
- Page Load Distributions: Categorizes a page as Fast, Average, or Slow by comparing against all FCP and DCL events in the Chrome User Experience Report.
- Page Stats: Indicates if the page might be faster if the developer modifies the appearance and functionality of the page.
- Optimization Suggestions: A list of best practices that could be applied to a page. If the page is already fast then suggestions will not be displayed.
Here is a look at what the new PageSpeed Insights looks like in action:


