Google Tag Manager is an invaluable tool for digital marketers.
It allows you to deploy tracking tags across the spectrum of analytics and advertising platforms all through one simple interface.
Google recently announced an overhaul of the Preview Mode in Google Tag Manager (GTM).
Preview Mode is an incredibly useful feature allowing you to determine if tags are firing properly and what data GTM is picking up on before you make any changes live.
The previous Preview Mode showed up in a pane at the bottom of your window and only tracked tags that fired and interactions that occurred on the page you were on.
Once you clicked to another page, the data in the pane would reset.
The new Preview Mode opens in a separate tab and tracks tags and interactions for the duration of your session on the site, allowing you to see a more comprehensive overview.
This setup appears to merge features previously available in the Tag Assistant Chrome Extension into the built-in Preview Mode
In this article, I’ll cover an overview of the new preview mode and how you can take advantage of updated features to assess your tagging setups.
1. Accessing Preview Mode
To access Preview Mode, look for the Preview button in the upper-right section of the top bar in GTM.
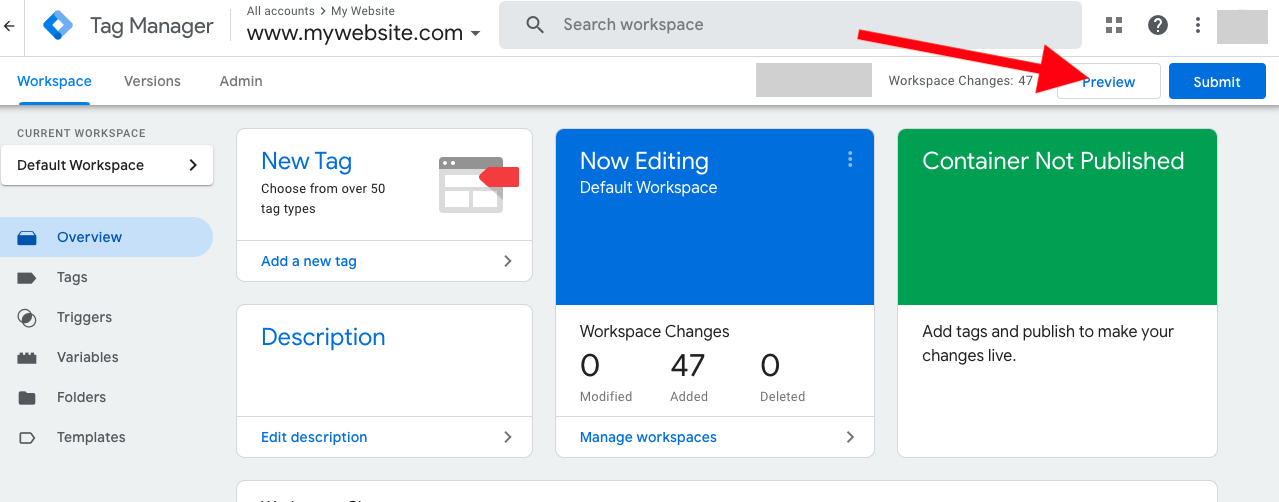
Click this button, and you’ll see an option to “Start Tag Assistant.”
Here, you can enter the URL you want to preview.
Once you click the Start button, you’ll be taken to the site.
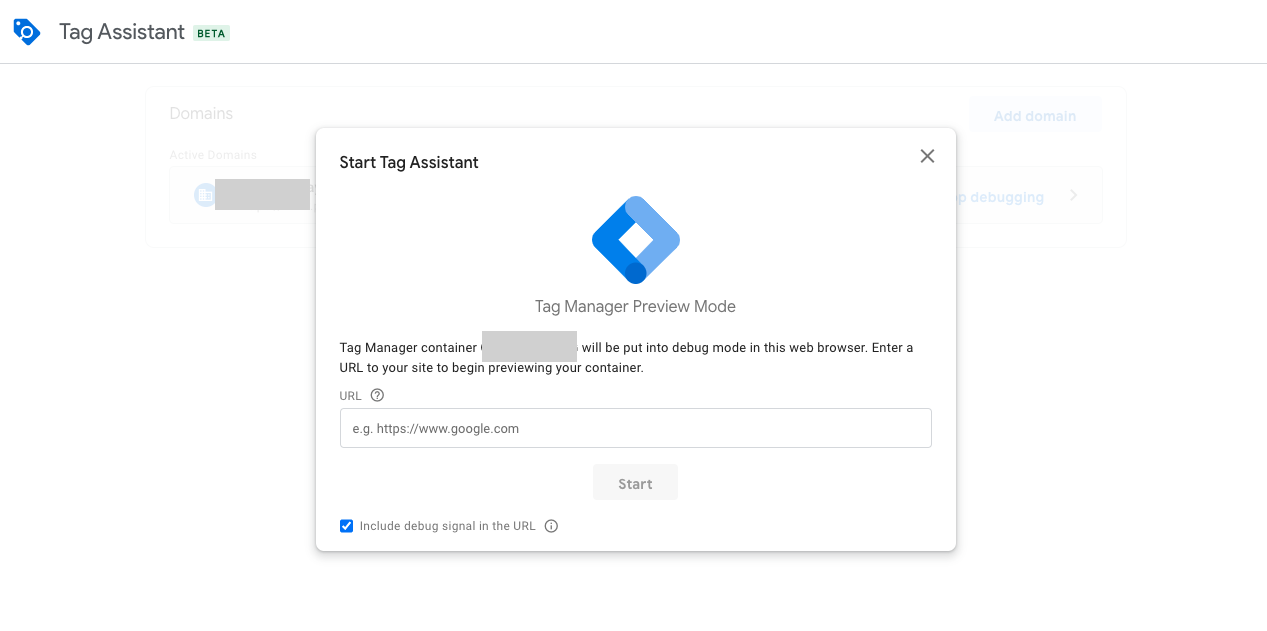
Note that you’ll now see two separate new tabs:
- One for Tag Assistant.
- Another for the website itself that you’re previewing.
As you click through the site and complete actions, you’ll see details for all the tags that fire, associated with each page, on the Tag Assistant tab.
You’ll also notice a small overlay in the lower left-hand corner of the site saying “Debugger Connected”; you can click the X on this box to end the preview process.

The left sidebar shows each page that you’ve accessed (each denoted by a colored box and an arrow dropdown to the left).
You’ll also see events numbered in the order that they took place (Container Loaded, DOM Ready, Window Loaded, etc.).
Each of these denotes an event the GTM monitors in order to fire triggers and collect data.
You can click each event to determine:
- Which tags fired when.
- What variables were associated.
- What values are held in the Data Layer.
- Any errors that occurred.
You can also click the arrow next to a page to compress/expand the associated events to make it easier to view your full session on the website in context.
2. Examining Specific Tags
If you want to see more details about tags that fired, you can click on the tag within the Tag Assistant tab.
For instance, say that you want to double-check on your Google Ads Remarketing tag.
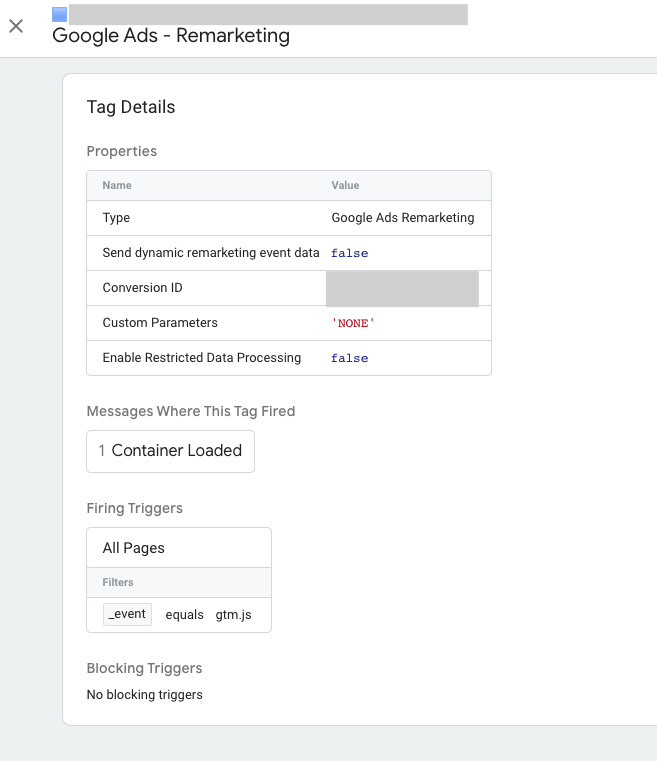
If you click it, you’ll see the following details:
- Properties, including the Conversion ID and fields for additional settings relating to the tag.
- Where the tag fired (in this case when the container loaded).
- Any firing triggers associated with the tag.
- Blocking triggers preventing it from firing.
If you’re using a tag that correlates with specific variables (placeholders for values), you can see those listed in the Variables sections.
For instance, you might have set up scroll depth tracking to fire events when people reach certain points on the page.
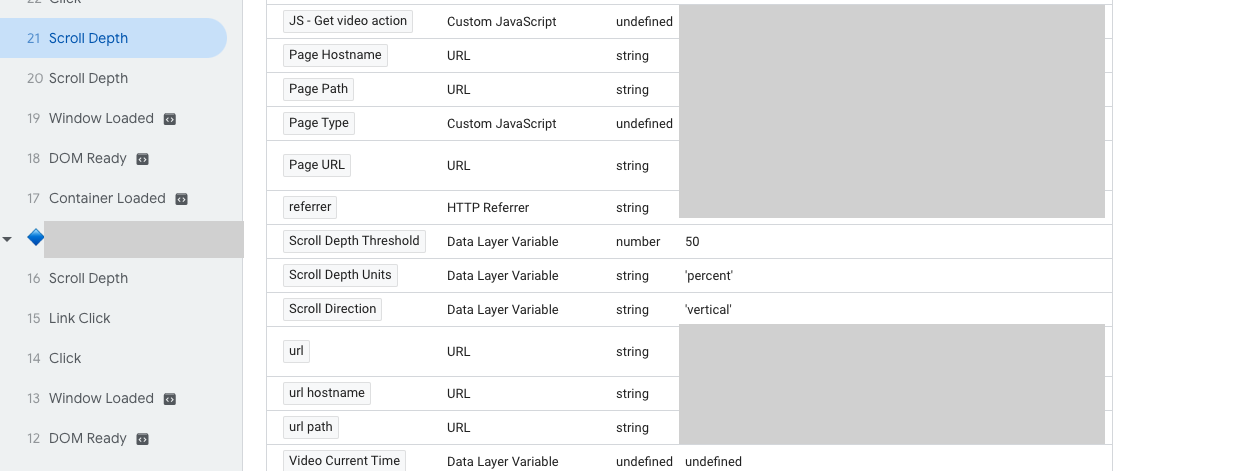
You can see the associated variables for each “Scroll Depth” event. In this example, you can see:
- Scroll Depth Threshold = 50
- Scroll Depth Units = percent
- Scroll Direction = vertical
This criteria means the event correlates with a user scrolling vertically to the 50% point on the page.
Inspecting variables can be a valuable area to check when you’re trying to set up triggers based on IDs/classes/etc. in your site.
This practice can determine if a trigger is actually seeing the right element in your site when troubleshooting your setup.
If you’ve set up custom events to fire in the Data Layer, you can check the Data Layer tab to see what’s currently held here.
Finally, check the Errors tab to flag any issues that are being flagged by GTM when tags don’t fire properly.
3. Ending Your Preview Session
If you’ve gone through several pages and just want to clear out what’s been tracked so far to “start fresh,” click the trash can in the upper left panel next to “Summary.”
This action will clear data for all tags that have fired so far; now you can see any tags that fire going forward as you continue clicking through the site.
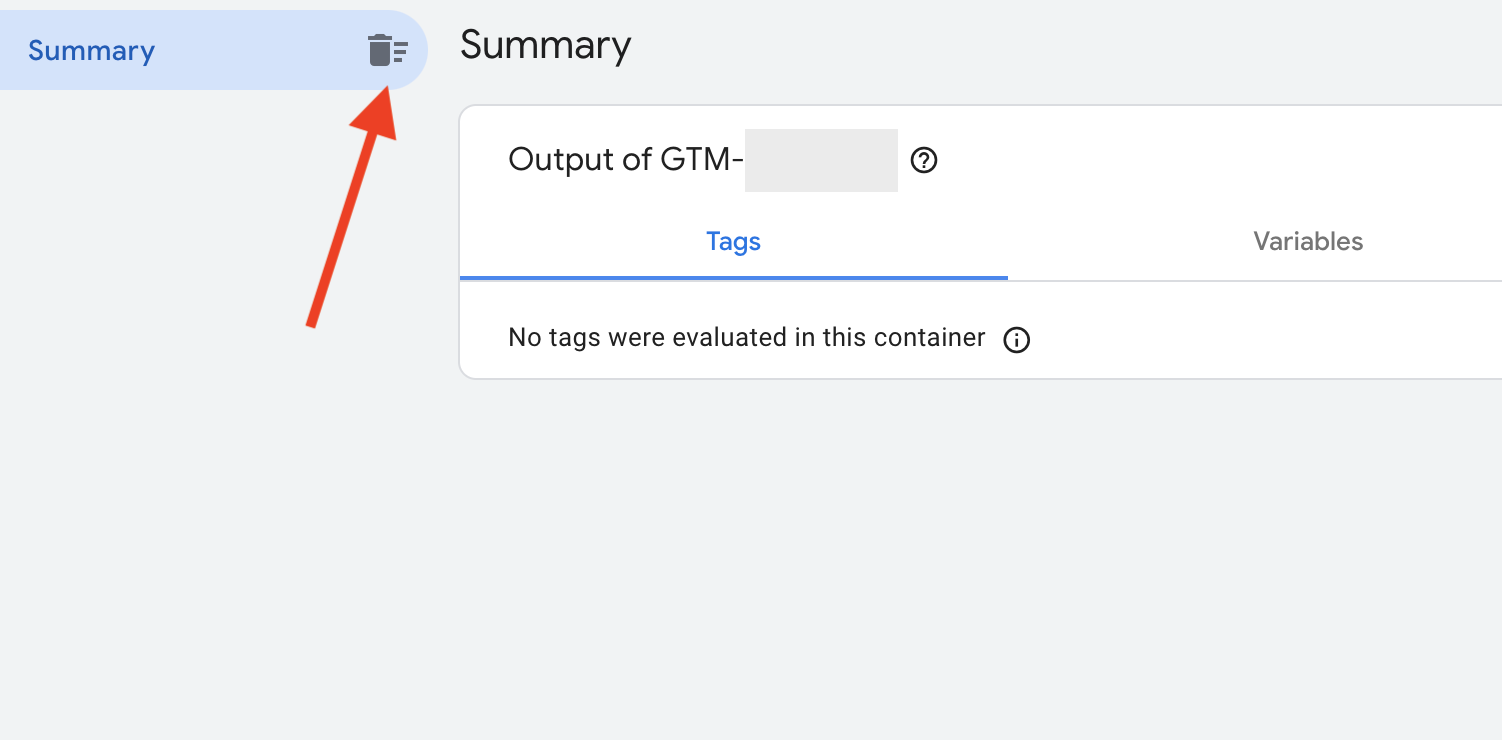
When you’re ready to completely end your preview session, you can either close the Tag Assistant tag or click the X on the “Debugger connect” overlay on the site you’re reviewing.
4. Previewing Previous Versions
Playing with different setups in your GTM account to get a tag to fire properly and want to compare an older version versus a new one?
You can select a previous version of your GTM container from the Versions tab.
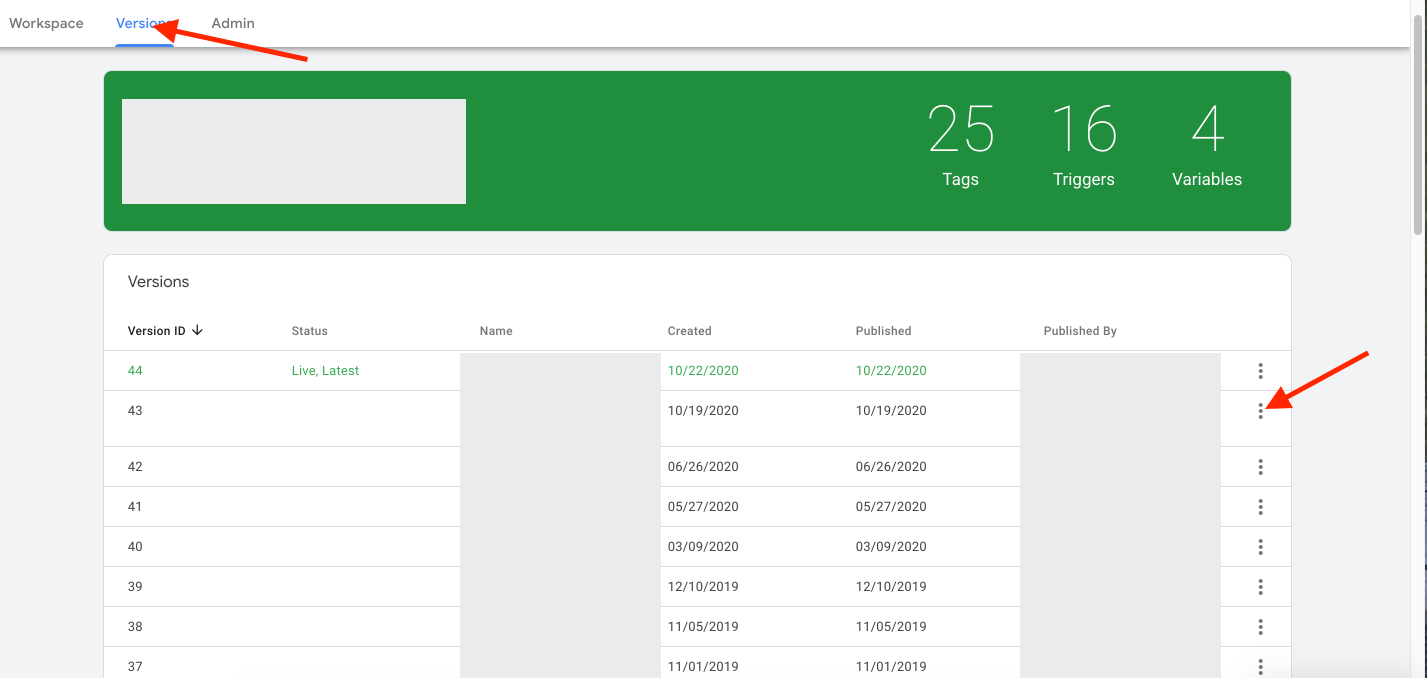
Click the three dots next to the version you want and choose Preview.
You can also select Share Preview to send an option to someone else to preview a particular link and GTM container version.
Start Testing Your GTM Setups
Whenever you’re setting up tags and triggers in GTM, you should be testing before you push your changes live to ensure that everything is working as intended.
The updates to GTM’s preview mode allow marketers to more easily assess how tags fire across a multi-page session.
You can troubleshoot why tags aren’t working by looking at errors and the specific variables that show up.
If you’re a GTM user and haven’t logged in for a while, take a moment to check out the updated preview mode.
If you’re a new GTM user, start making preview mode part of your process!
More Resources:
- 5 Amazing Google Ads Tools You Need to Use
- 10 Paid Search & PPC Best Practices
- PPC 101: A Complete Guide to PPC Marketing Basics
Image Credits
Featured Image: Canva
Screenshots taken by author, October 2020


![AI Overviews: We Reverse-Engineered Them So You Don't Have To [+ What You Need To Do Next]](https://www.searchenginejournal.com/wp-content/uploads/2025/04/sidebar1x-455.png)