

Graphs help us understand the real world better by mathematical abstractions and models in order to define the entities and the relations between them in structures.
Many real-world applications use graphs, including search engines.
Search engines use graphs for different purposes, such as understanding the popularity of pages or detecting spam links.
Centrality is an important concept used for graphs. We use a quantitive measure called centrality measure to discover the importance of the nodes which are essential units forming a graph.
A very popular search engine is known to identify the popularity of nodes (webpages) by using PageRank as the measure of centrality. PageRank has been the most famous centrality measure for graphs.
There are some other measures such as:
- Eigenvector.
- Betweenness.
- Katz.
- Closeness.
- Hits (Hyperlink-Induced Topic Search).
- Harmonic Centrality.
In this article, I will focus on “Harmonic Centrality” because it is a promising and, in theory, low-cost measure of centrality.
Harmonic Centrality
Harmonic centrality is a much recent measure than most of the other centrality measures and a variant of another measure that is closeness centrality.
It was first proposed by Massimo Marchiori and Vito Latora in 2000, then by Dekker (2005) and Rochat (2009).
Harmonic Centrality is the distance-based centrality measure, unlike PageRank.
In the PageRank algorithm, the importance of a node is given by the importance of the neighborhood but not the distance. The more important pages point a page, the more important that page becomes.
To understand harmonic centrality in simple terms, here’s an example.
Imagine there is a page called example.
If there are 50 pages linking directly to this page, they are called as pages at Distance 1, and you begin your count as 50.
There may be pages linking to example page but not directly so we call them Distance 2. Let’s say there are 100 such pages, this time we count as 50 and add to the 50 we have making our score 100.
There can be pages in Distance 3 with 150 links this time. So we count as 50 which makes our total score of 150.
It is much easier to understand than PageRank, isn’t it?
Best Centrality Measure
Harmonic centrality can be selected as one of the easiest centrality measures to understand and we can stop there.
However, it has also been selected as the best centrality measure in a scientific paper. The authors of the research, Paolo Boldi and Sebastiano Vigna describe the best centrality measure with these words:
“Our results suggest that centrality measures based on distances, which in the last years have been neglected in information retrieval in favour of spectral centrality measures, do provide high-quality signals; moreover, Harmonic Centrality pops up as an excellent general-purpose centrality index for arbitrary directed graphs.”
There is a compelling video titled “A Modern View of Centrality Measures” where Boldi talks about the centrality measures in general and harmonic centrality in particular.
In the video, he also presents a comparison of PageRank and harmonic centrality measurements on the Hollywood graph. In his specific example, harmonic centrality selects top nodes better than the PageRank.
Additionally, nonprofit organization Common Crawl which has been crawling the web since 2011 prefer this centrality measure.
Since 2017, Common Crawl has been using harmonic centrality in their crawling strategy for prioritization by link analysis.
When they list domain level information in their blog posts, the domains are ranked according to their harmonic centrality values, not to their PageRank values.
In this article, I will conduct data analysis to find out if its calculation cost is less than PageRank.
There is software that approximates harmonic centrality for very large graphs in order to further reduce its computation cost. I haven’t used it but it’s worth mentioning in case you want to try it out yourself.
For search engines and for SEO, harmonic centrality is a useful centrality measure because it:
- Is simple to understand and explain.
- Gives intriguing results on web graphs.
- Is not a metric which needs iteration, thus its calculation cost can be less in theory.
Comparing Harmonic Centrality & PageRank
Comparison on Small Graphs
Homemade Graphs
Dataset information
I created some very small web graphs and calculated the nodes(pages) PageRank and five other centrality measure values in order to compare them and give you a better understanding of Harmonic Centrality measure.
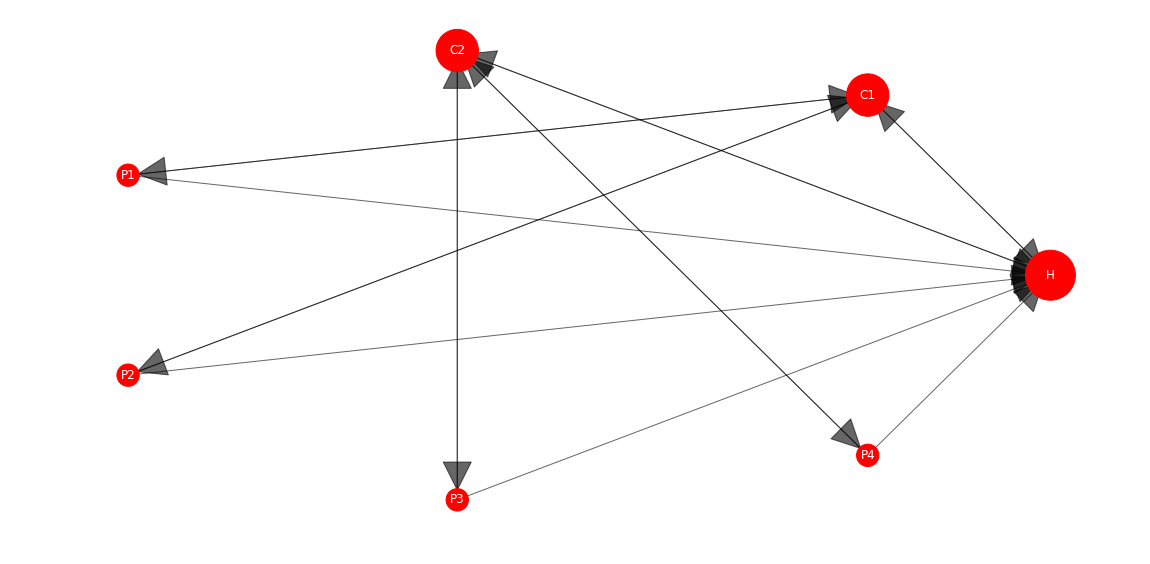
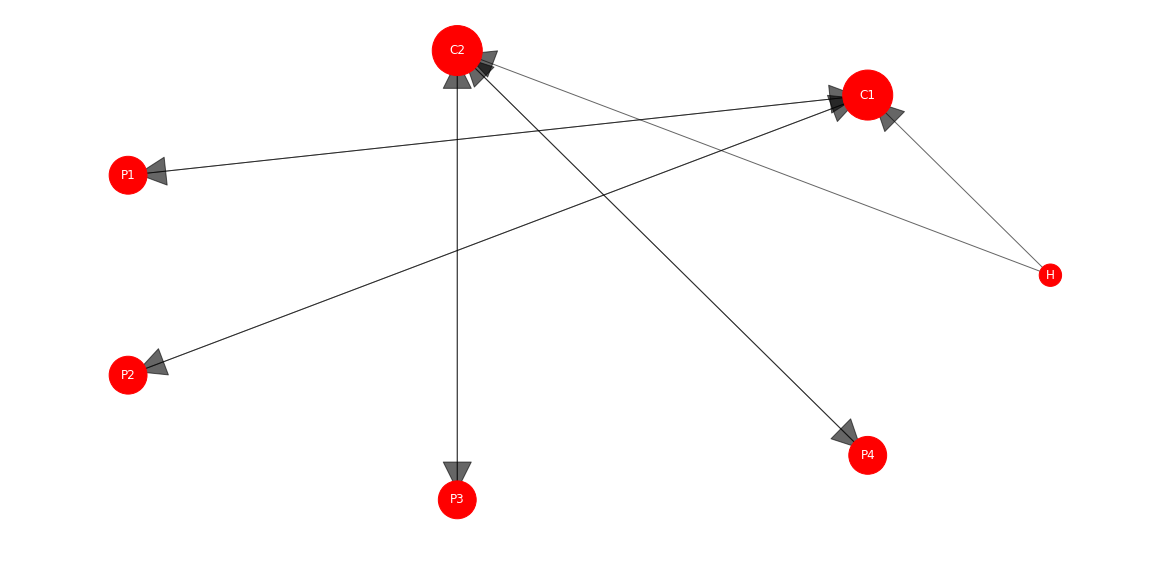
Imagine very small websites having a homepage, as well as category and product pages. Let’s use H, C1, C2, P1, P2, P3, P4 as aliases for the homepage, first, second category pages and first, second, third and fourth product pages, respectively.
- H = Homepage
- C1 = Category page 1
- C2 = Category page 2
- P1 = Product page 1
- P2 = Product page 2
- P3 = Product page 3
- P4 = Product page 4
I calculated PageRank and five centrality measures on these very small datasets and visualized them as graphs.
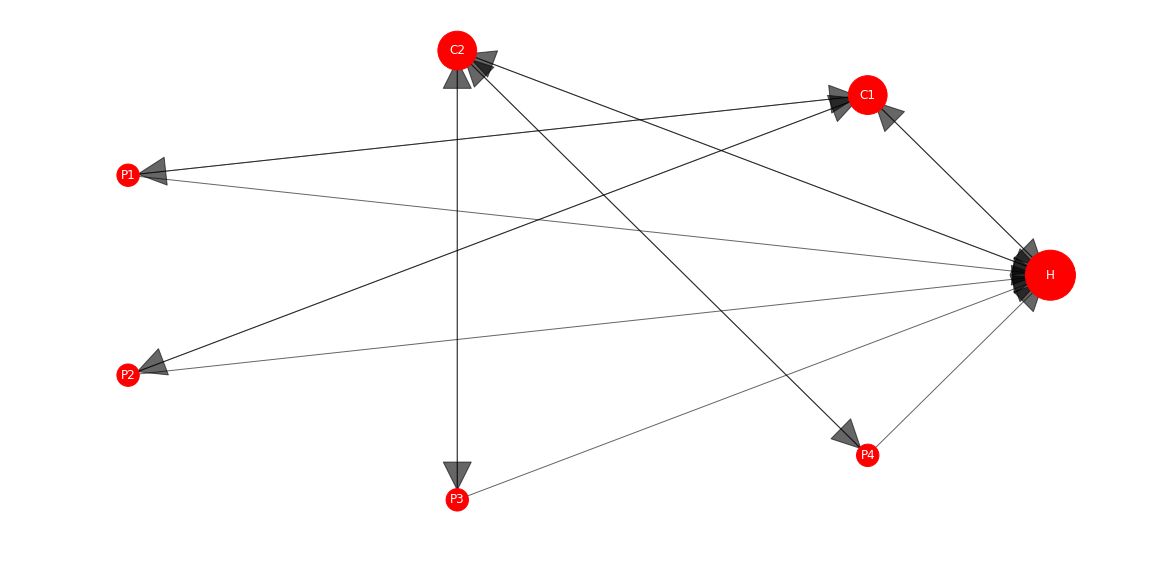
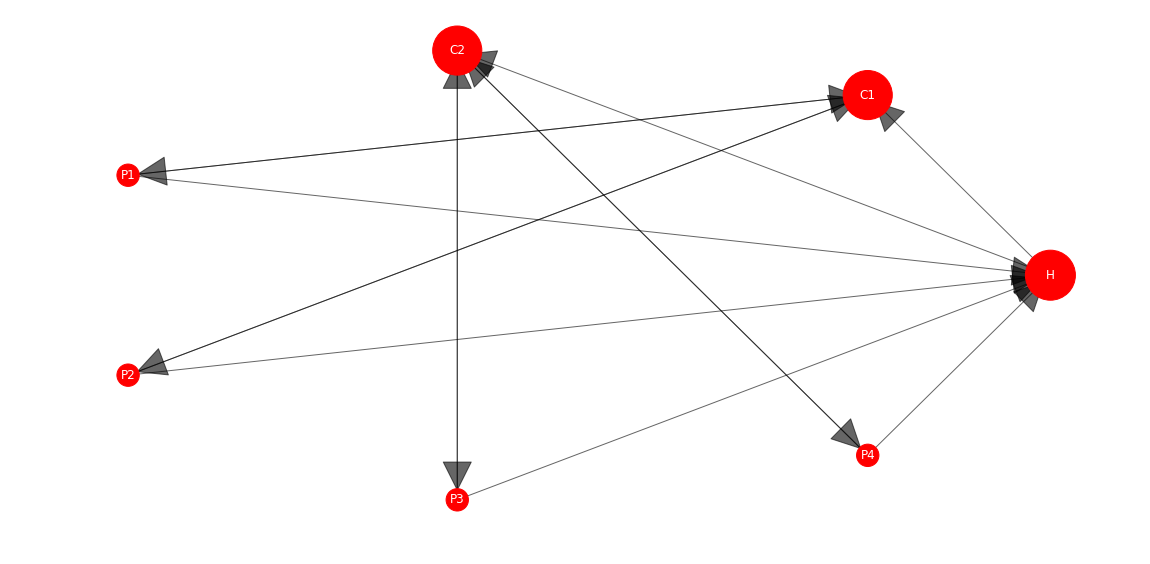
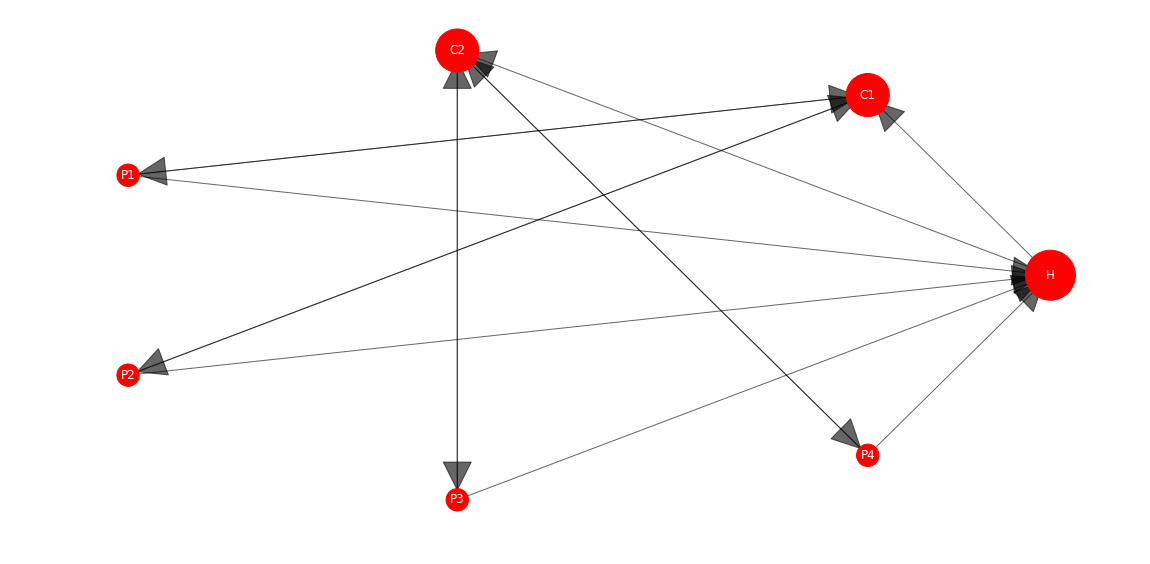
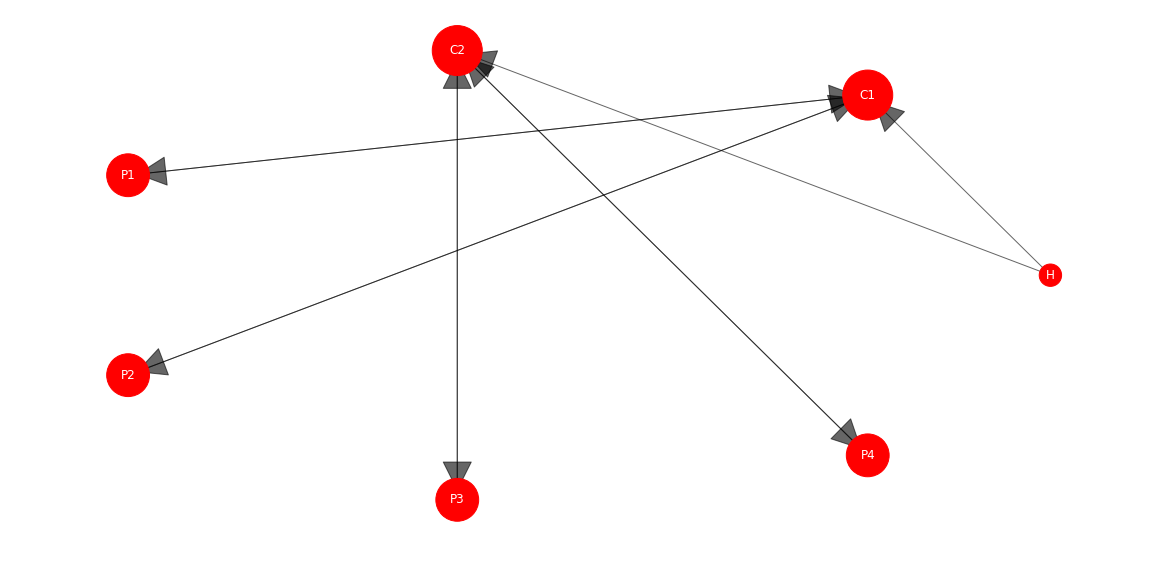
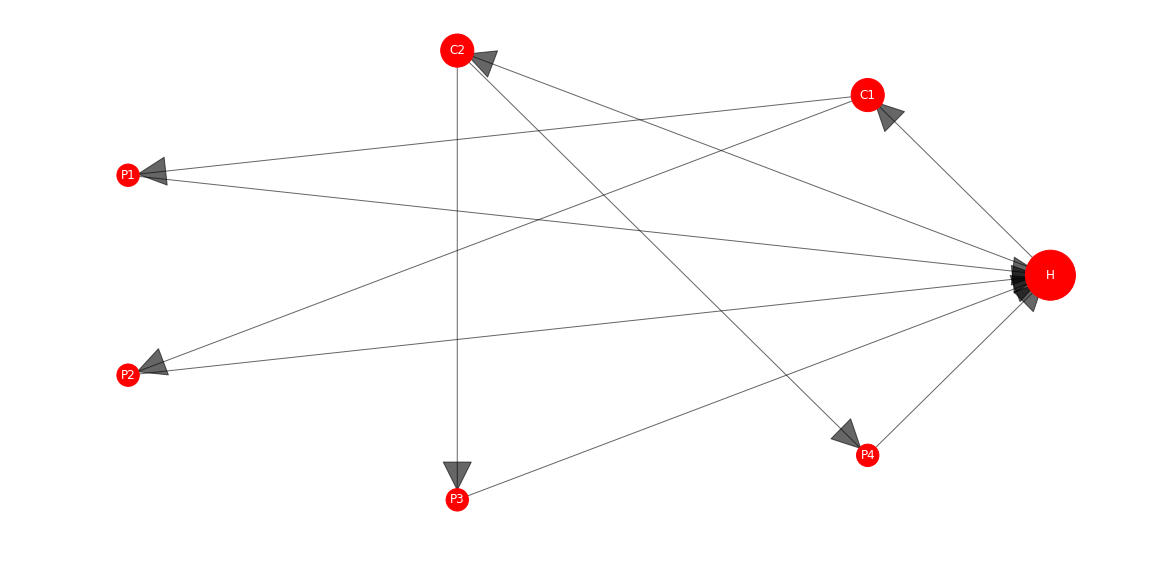
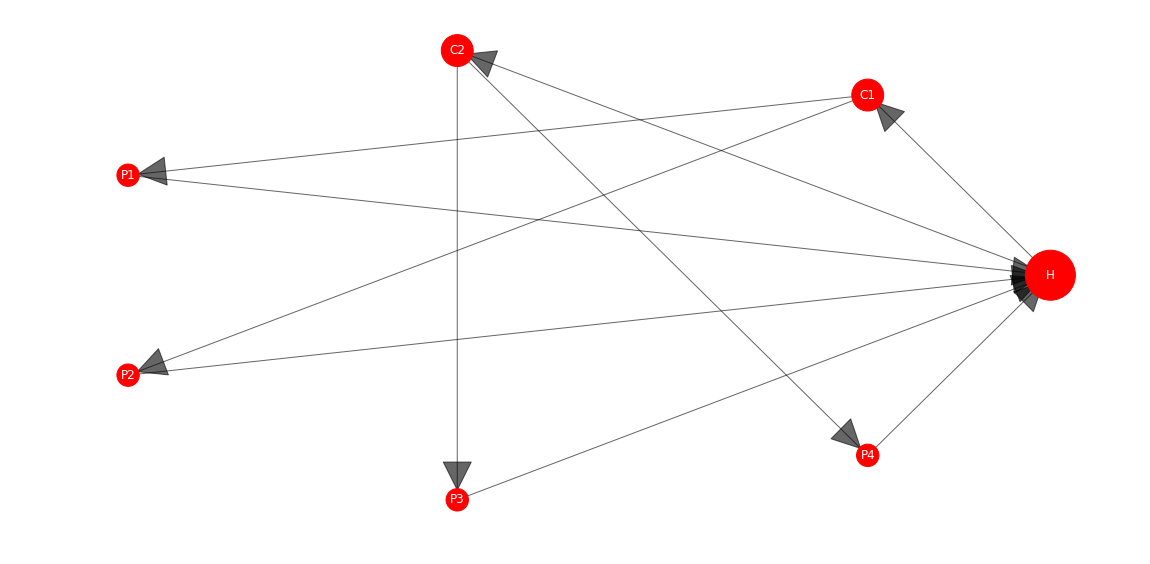
For simplicity, only PageRank and Harmonic Centrality graphs are presented. On these graphs, the node sizes show the importance of their chosen centrality measure values.
Centrality measure values compute times on homemade graphs and Stanford-web graph are calculated on MacBook Pro with four cores and 16GB RAM.
Graph 1
Dataset Information
Pages: 7
Links: 16
Compute Time
PageRank
CPU times: user 1.01 ms, sys: 0 ns, total: 1.01 ms
Wall time: 1.02 µs
Eigenvector
CPU times: user 392 µs, sys: 1 µs, total: 393 µs
Wall time: 398 µs
Betweenness
CPU times: user 242 µs, sys: 1e+03 ns, total: 243 µs
Wall time: 247 µs
Katz
CPU times: user 576 µs, sys: 13 µs, total: 589 µs
Wall time: 613 µs
Closeness
CPU times: user 235 µs, sys: 1e+03 ns, total: 236 µs
Wall time: 240 µs
Harmonic
CPU times: user 665 µs, sys: 9 µs, total: 674 µs
Wall time: 689 µs
Statistics
Correlations with PageRank
Eigenvector: 0.990128
Betweenness: 0.995301
Katz: 0.973233
Closeness: 0.966720
Harmonic: 0.987344
Graph 1 PageRank
Graph 1 Harmonic Centrality
 Graph 2
Dataset Information
Pages: 7
Links: 14
Compute Time
PageRank
CPU times: user 1.01 µs, sys: 0 ns, total: 1.01 µs
Wall time: 1.01 µs
Eigenvector
CPU times: user 393 µs, sys: 1e+03 ns, total: 394 µs
Wall time: 398 µs
Betweenness
CPU times: user 241 µs, sys: 0 ns, total: 241 µs
Wall time: 247 µs
Katz
CPU times: user 499 µs, sys: 1 µs, total: 500 µs
Wall time: 505 µs
Closeness
CPU times: user 224 µs, sys: 1 µs, total: 225 µs
Wall time: 229 µs
Harmonic
CPU times: user 597 µs, sys: 9 µs, total: 606 µs
Wall time: 625 µs
Statistics
Correlations with PageRank
Eigenvector: 0.999605
Betweenness: 0.917375
Katz: 0.986605
Closeness: 0.946069
Harmonic: 0.975830
Graph 2 PageRank
Graph 2 Harmonic Centrality
 Graph 3
Dataset Information
Pages: 7
Links: 10
Compute time
PageRank
CPU times: user 2.85 µs, sys: 148 µs, total: 2.99 µs
Wall time: 2.92 µs
Eigenvector
CPU times: user 505 µs, sys: 1e+03 ns, total: 506 µs
Wall time: 510 µs
Betweenness
CPU times: user 153 µs, sys: 1 µs, total: 154 µs
Wall time: 158 µs
Katz
CPU times: user 436 µs, sys: 0 ns, total: 436 µs
Wall time: 442 µs
Closeness
CPU times: user 142 µs, sys: 0 ns, total: 142 µs
Wall time: 146 µs
Harmonic
CPU times: user 283 µs, sys: 1e+03 ns, total: 284 µs
Wall time: 289 µs
Statistics
Correlations with PageRank
Eigenvector: 0.930335
Betweenness: 0.873700
Katz: 0.996401
Closeness: 0.979220
Harmonic: 0.952115
Graph 3 PageRank
Graph 3 Harmonic Centrality
 Graph 4
Dataset Information
Pages: 7
Links: 10
Compute time
PageRank
CPU times: user 2.76 µs, sys: 374 µs, total: 3.13 µs
Wall time: 2.77 µs
Eigenvector
CPU times: user 730 µs, sys: 177 µs, total: 907 µs
Wall time: 722 µs
Betweenness
CPU times: user 242 µs, sys: 0 ns, total: 242 µs
Wall time: 248 µs
Katz
CPU times: user 330 µs, sys: 0 ns, total: 330 µs
Wall time: 335 µs
Closeness
CPU times: user 210 µs, sys: 0 ns, total: 210 µs
Wall time: 215 µs
Harmonic
CPU times: user 740 µs, sys: 1 µs, total: 741 µs
Wall time: 745 µs
Statistics
Correlations with PageRank
Eigenvector: 0.993543
Betweenness: 0.998952
Katz: 0.962346
Closeness: 0.998952
Harmonic: 0.997933
Graph 4 PageRank
Graph 4 Harmonic Centrality
Plot of the Correlations of 5 Centrality Measures with PageRank on 4 Homemade Graphs
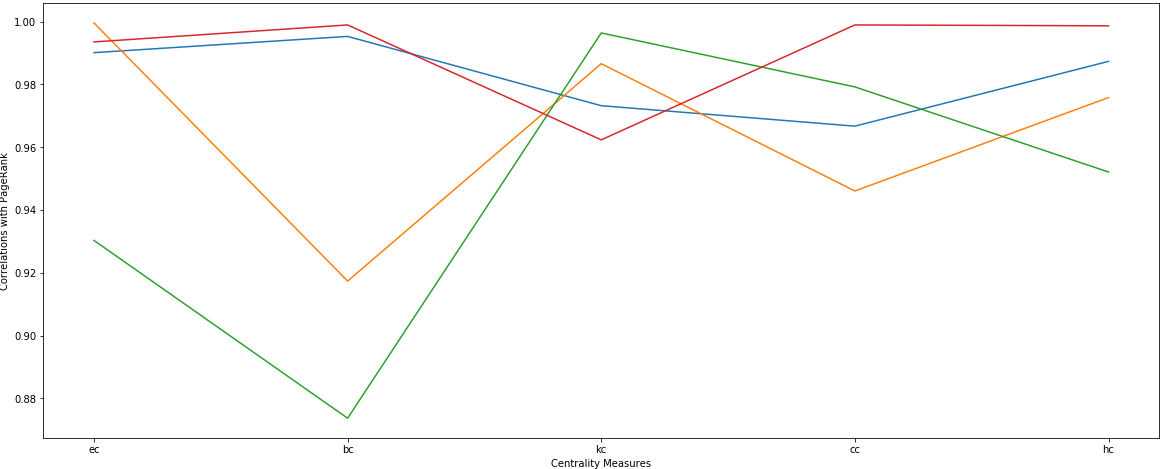
Labels on X-axis
ec: Eigenvector Centrality
bc: Betweenness Centrality
kc: Katz Centrality
cc: Closeness Centrality
hc Harmonic Centrality
Mean of the Correlations of 5 Centrality Measures with PageRank on 4 Homemade Graphs
Eigenvector: 0.979369
Betweenness: 0.938920
Katz: 0.976432
Closeness: 0.975019
Harmonic: 0.97649
Harmonic Centrality has the second highest mean of correlations on four graphs with PageRank after Eigenvector Centrality which is a cousin of PageRank.
Comparison on Large Graphs
Stanford-Web Graph
Dataset Information
This web graph is available here.
Nodes represent pages from Stanford University (stanford.edu) and directed edges represent hyperlinks between them. The data was collected in 2002.
Nodes: 281 903
Edges : 2 312 497
Compute Time
PageRank
CPU times: user 1min 17s, sys: 2.3 s, total: 1min 19s
Wall time: 1min 19s
Harmonic Centrality
CPU times: user 1min 18s, sys: 1.96 s, total: 1min 20s
Wall time: 1min 20s
Statistics
- PageRank
mean, min, max of pr_val = 3.547319e-06, 5.681687e-07, 6.512977e-03
- Harmonic Centrality
mean, min, max of harmonicc_val = 31132.897898, 1.001467, 106023.735213
- Statistics
Correlation on 282 K pages
correlation(pr_val, harmonicc_val) = 0.013566
Correlations of Top Pages Sorted According to Harmonic Centrality Values
Top 100
Correlation(PageRank.Harmonic Centrality) = 0.916071
Top 1000
Correlation(PageRank.Harmonic Centrality) = 0.691981
Top 10 000
Correlation(PageRank.Harmonic Centrality) = 0.682505
Top 100 000
Correlation(PageRank.Harmonic Centrality) = 0.012681
These correlation scores above show us that PageRank and Harmonic Centrality algorithms agree on almost the top 10 K pages (not on the pages but the distribution of the importance of the pages) but afterwards, they don’t share the same opinion on other pages’ popularity distribution.
Number of Intersected Top Pages Between Pagerank and Harmonic Centrality
In top 100: 8
In top 1000: 66
In top 10 000: 299
In top 100 000: 41 138
Number of Intersected Weakest Pages Between Pagerank and Harmonic Centrality
There is no intersection till 10 000 weakest pages but for 100 000 weakest pages the intersection is 23 417.
Data Visualization
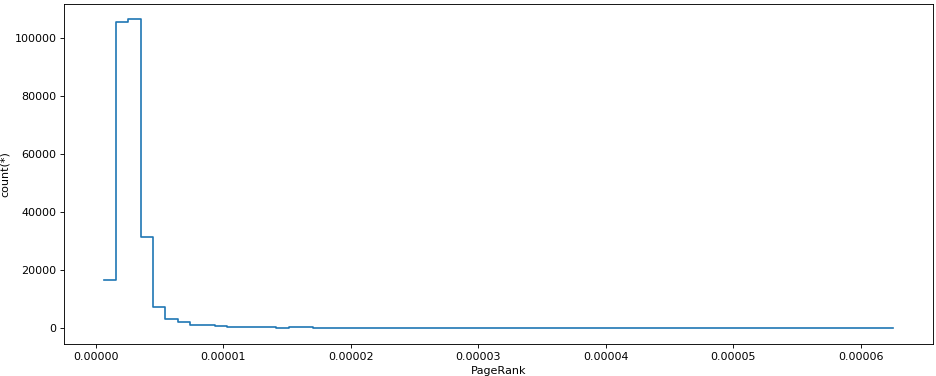
PageRank Distribution
The PageRank distribution graph shows us that this distribution is highly right-skewed meaning the majority of the pages have very low PageRank.
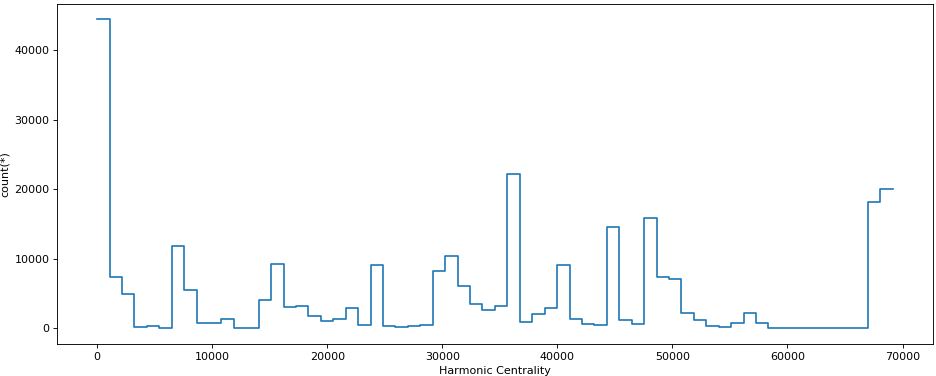
 Harmonic Centrality Distribution
The Harmonic Centrality distribution is not highly right-skewed so we can’t say that majority of the pages have low values like PageRank. This distribution is multi-modal.
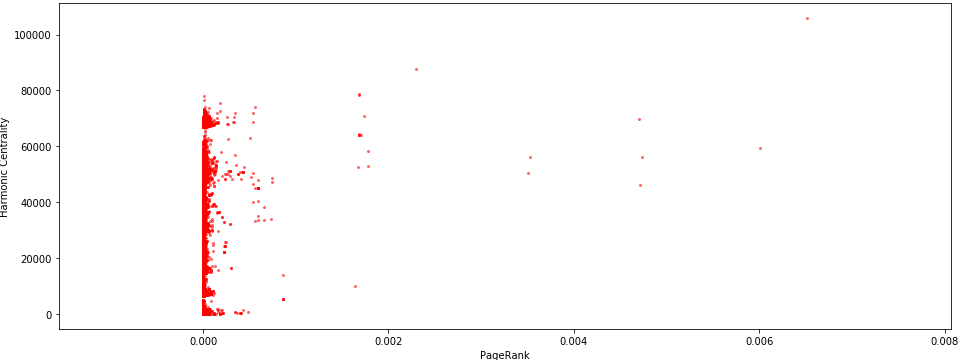
 Scatter Plot of PageRank and Harmonic Centrality
When we scatter plot the PageRank and Harmonic Centrality values of pages we observe what we have seen in the statistics part which is PageRank and Harmonic Centrality values of domains are not correlated.
Common Crawl Graph
Dataset Information
On Common Crawl’s recent blog post, they shared a file (cc-main-2018-aug-sep-oct-domain-ranks.txt.gz [1.89 GB]) that provides 87 million domains’ most recent Harmonic Centrality and PageRank values.
Below are the statistics from this file about PageRank and Harmonic Centrality values of 87 million domains.
Compute Time
Sebastian Nagel from Common Crawl technical team kindly answered my question about computing time differences between PageRank and Harmonic Centrality algorithms calculations on Common Crawl graph and also allowed me to share his response with you:
“Computation was done on a machine with 48 CPUs and 384 GB RAM using the web graph resp. the law library which was written by Vigna and Boldi.
At a first glance, a look on the “real” wall-clock time and “user” time (used CPU-seconds) would even suggest that the harmonic centrality is faster for the larger host-level graph. However, my guess would be that the processing time is mostly influenced by:
- Graph structure (e.g., amount of dangling nodes).
- The number of iterations until the scores converge.
- (Hyperball / harmonic centrality) size of the hyperloglog counters.”
Statistics
- PageRank
mean, min, max of pr_val = 1.1473075614418515e-08, 4.48131407e-09, 1.72100302e-02
- Harmonic Centrality
mean, min, max of harmonicc_val = 9421776.2697027, 0. , 24993276.
- Correlations
Correlation on 87 Million Domains
correlation(pr_val, harmonicc_val) = 0.00432823
Correlation of Top Pages Sorted According to Harmonic Centrality Values
Top 100
Correlation(PageRank.Harmonic Centrality) = 0.94826372
Top 1000
Correlation(PageRank.Harmonic Centrality) = 0.87727728
Top 10 000
Correlation(PageRank.Harmonic Centrality) = 0.63744096
Top 100 000
Correlation(PageRank.Harmonic Centrality) = 0.31725445
Data Visualization
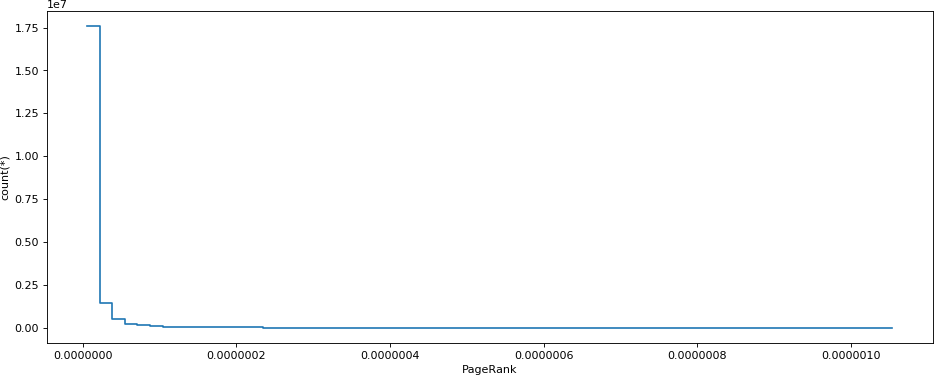
Pagerank Distribution
The graph below presents the plot of the count of PageRank values. It shows us that the distribution of PageRank on 87 million domains is highly right-skewed meaning the majority of the domains have very low PageRank.
 Harmonic Centrality Distribution
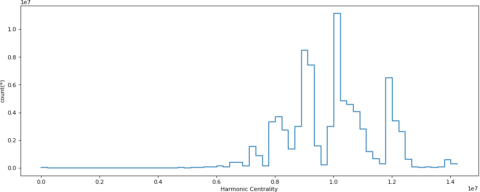
The graph below presents the plot of the count of Harmonic Centrality values of 87 million domains. It shows us that the distribution of Harmonic Centrality on 87 million domains is not highly right-skewed like the PageRank.
It is not a perfect Gaussian distribution but more Gaussian than the distributions of PageRank. This distribution is multi-modal too.
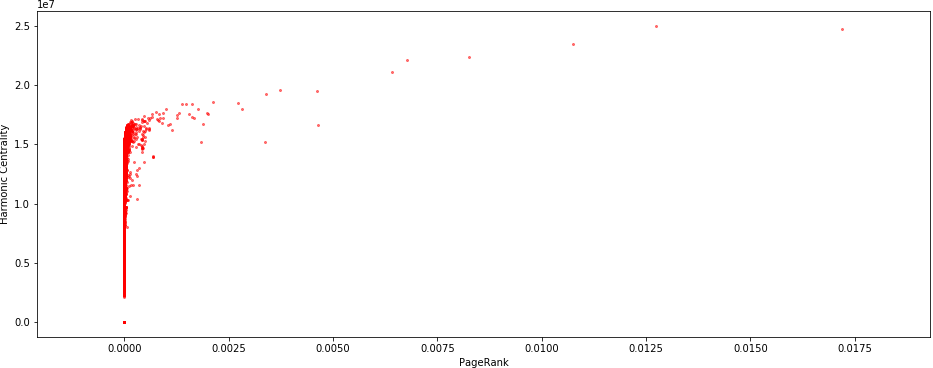
 Scatter Plot of Pagerank and Harmonic Centrality
When we scatter plot the PageRank and Harmonic Centrality values of domains we observe what we have seen in the statistics part which is PageRank and Harmonic Centrality values of domains are not correlated.
However what is also interesting to point out is that we observe the beginning of the domains’ PageRank values detachment when their Harmonic Centrality value is closer to 1e7 and accelerates when it is greater than.
What we remark from web Stanford and Common Crawl, large web graphs data analysis above is that Harmonic Centrality and PageRank agree more or less on the popularity of top and middle tail nodes but not the long tail.
Conclusion
To begin with, Harmonic Centrality is a measure of centrality that is easy to understand and explain.
Furthermore, it gives interesting results, especially for the top nodes of the graphs.
Last but not least, some organizations are already using this measure, for instance, Common Crawl, a nonprofit organization that has been crawling the web for several years, uses this measure in its crawling strategy.
On small graphs:
- PageRank and Harmonic Centrality give resembling results with PageRank.
- The computation time of Harmonic Centrality is much less than PageRank.
As the size of the graph increases their computation times tend to be similar.
For the sake of clarity, computation times are calculated on small graphs and web Stanford graph with an unoptimized Harmonic Centrality algorithm on a MacBookPro with four cores and 16 GB RAM.
On larger graphs, although PageRank and Harmonic Centrality have similar considerations on the distribution of the importance of top pages, at least for top 10 K pages, their opinions on the popularity distribution of the rest of the pages change dramatically afterwards. They agree more on top and middle tail nodes but less on the long tail.
Common Crawl’s technical team calculated Harmonic Centrality and PageRank on the recent Common Crawl graph with 48 CPUs and 384 GB RAM.
Consequently, Harmonic Centrality’s compute time is less than PageRank on paper. However, there are some lurking variables which may affect the result. Therefore, this issue requires further study.
In conclusion, I highly recommend you to look further into Harmonic Centrality. Its differences with PageRank aren’t negative points, on the contrary, they are positive since it brings us new insights.
Therefore, it will be beneficial for SEO to calculate the Harmonic Centrality values for the pages of your clients’ sites.
Accordingly, this may reveal striking information on those pages which you have not discovered by the help of PageRank. Besides, it is always a good idea to listen to what other algorithms want to tell us.
More Resources:
- How Search Engine Algorithms Work: Everything You Need to Know
- PageRank Patent Update – How it Impacts SEO
- 7 Useful Facts About PageRank
Image Credits
In-Post Images: Created by author, January 2019
