A small increase in your website’s conversion rate can mean a giant impact on your company’s bottom line. The best way to affect conversions is by using historic data to create a theory, then test that theory, measure the results, and adjust as necessary.
Google Analytics is an excellent tool that can provide comprehensive data to act on in this regard. Although they now offer a paid premium product (Analytics 360 Suite), their fully-functional base product, Google Analytics, is still incredibly useful — and free.
Ready to boost your e-commerce conversion rate?
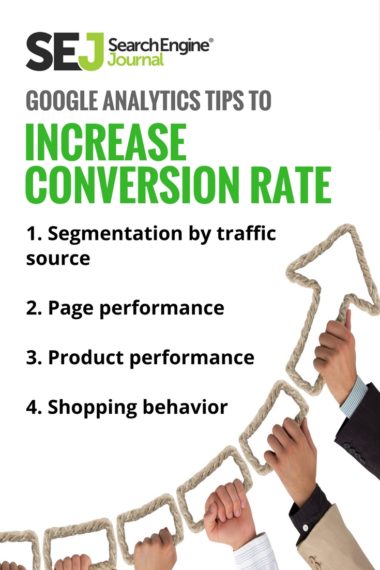
Segmentation by Traffic Source
Understanding the relationship of referring traffic sources to conversions is crucial. The data behind it will show you where to prioritize efforts.
Google Analytics allows users to track the how, when, and where:
- How people are coming to the website
- When they come to the website
- From where they were referred to the website
View data relating to traffic sources with this path:
Acquisitions > All traffic > Source
From there, you’ll be able to determine:
Which traffic sources bring the highest traffic volume
This may correlate with where you’re getting the most conversions. Knowing this should affect your promotional plans and how much effort or money you pour into each referral source.
Which traffic sources have the highest and lowest conversion rates
Knowing which sources have the lowest conversion rates will help you figure out which need more work and effort — or what areas to stop spending time and money in as a part of your promotional plan.
Which traffic sources have the most expensive visits
To accurately determine the answer to this query, you have to assign costs to each traffic source (i.e. ad cost, affiliate commissions, or even SEO fees divided by visit). Referral sources that tend to have an easily measurable cost per click (visit) include social media ads, AdWords, and banner advertising.
In some cases, higher costs per click actually result in more conversions. That’s why this data is important to determining whether it’s worth investing in ads (and if certain types are a better investment).
On a similar note, using Google Analytics’ Goals feature allows you to assign values to each conversion. This can be a useful way to measure non-purchase activities, like signing up for email updates or clicking a “Follow Us on Social” link.
Which source gets more traffic between mobile and desktop
Having low traffic on mobile could be a bad sign since mobile use makes up such a large percentage of internet use. Low traffic on mobile is most likely a result of your website not being responsive and a sign that you need to consider mobile usability (especially if your site might experience a mobile interstitials penalty).
Pages Performance
Many e-commerce websites are working to add personalization elements to their websites. Gigya shares that 45% of online shoppers are more likely to shop on a site that offers personalized recommendations. 40% of consumers buy more from retailers who personalize the shopping experience across channels. Therefore, optimizing dynamic landing pages means that visitors are more likely to convert.
Google Analytics allows you to see how visitors act while they are on your website. You can use this path to access relevant data:
Behavior > Site Content > All Pages
For an e-commerce website with hundreds or thousands of pages, it allows you to break down which pages get the highest traffic volume, as well as your top landing and exit pages.
Find out which product pages have the most traffic, and use that insight to personalize your website. Landing pages, or the first pages visitors land on, are the most crucial. These pages need to convert immediately or drive someone to the beginning of a funnel.
Low performance on important landing pages is a red flag that needs to be investigated. But that’s not all — exit pages are another crucial consideration because they represent where people decided to leave the website.
Product Performance
Aside from looking at specific pages to determine which products are performing well (from a traffic perspective) on your website, Google Analytics also allows you to monitor actual product performance. This is the path you’ll want to follow to view the report:
Conversions > eCommerce > Product Performance
This report requires you to implement e-commerce tracking for access. E-commerce tracking is a snippet of code you can install on your e-commerce website to collect transaction data, including:
- Product sales
- Purchase amounts
- Billing locations
E-commerce tracking allows for seamless integration of data with Google Analytics. It allows you to easily understand the value of different user actions on your website.
Please note that this plugin is slightly different than the enhanced e-commerce plug-in, and the two should not be used together on the same property.
According to Google, enhanced e-commerce “…enables the measurement of user interactions with products on e-commerce websites across the user’s shopping experience, including product impressions, product clicks, viewing product details, adding a product to a shopping cart, initiating the checkout process, transactions, and refunds.”
Enhanced e-commerce requires a more elaborate setup, but can also provide much more detailed insights. For now, let’s focus on the easier to implement, and still incredibly insightful data that comes from e-commerce tracking.
Product performance data allows you to see which products or categories make the most money. Like with page performance, you can use this data for prioritizing pages or recommending products on landing pages and email campaigns. Knowing which of your products make the most money will help you understand what to offer to visitors in order to assist conversions.
On that note, Google Analytics allows you to see which product is converting at the highest rate. This will also help you figure out which products are not doing well, and whether they need more marketing/promotion or a product improvement. With e-commerce tracking, you can also view data relating to which products have the highest return rate. A high return rate can be a red flag for a bigger product problem.
Shopping Behavior
It can be valuable to know what exactly your visitors are looking for. To do this, monitoring your visitor’s shopping behavior is essential. Here’s the path you’ll use to do so:
Conversions > Shopping Analysis > Shopping Behavior
Visitors, especially first-timers, tend to browse many different pages to get an idea of selection. By understanding how they navigate your website, you can also analyze behaviors like if they proceed to checkout (and complete the process) or if they abandon the process in the middle of shopping. Further examination can reveal why they stop at a certain point and how to potentially fix the problem.
If your website has a search bar, make sure you’re monitoring queries on Google Analytics. You can take a look at what people are searching for on your website with this path:
Behavior > Site Search > Search Terms
Looking through the site search report gives you direct access to valuable data about your customers. It can help you determine if it makes sense to add a product that customers seem to be demanding.
Google Analytics is an essential tool for analyzing website data and making informed decisions for improving performance. Since the bottom line for an e-commerce company can be hugely influenced by a small percentage increase in performance, it’s important to dig into the data, looking for problems and opportunities to improve existing assets. If you’re looking to take a deeper look at conversion paths in Google Analytics, SEJ writer Ben Wood can walk you through more advanced uses of this tool.
The aforementioned reports can help you determine how to increase your e-commerce conversion rate using Google Analytics, and create a plan of attack.
Increase Your E-Commerce Conversion Rate Using Google Analytics
Do you have any tips on how to increase your e-commerce conversion rate using Google Analytics? Maybe a little-known report or strategy that can make a difference? We’d love to hear from you! Tweet your tips at @SEJournal, and we’ll share our favorites!


![AI Overviews: We Reverse-Engineered Them So You Don't Have To [+ What You Need To Do Next]](https://www.searchenginejournal.com/wp-content/uploads/2025/04/sidebar1x-455.png)