

As SEO professionals, we’re data-driven. So, it’s ironic that we need to ask a counterintuitive question: “Where are the missing bullet holes in Google Analytics 4 (GA4)?”
Most of us trust the event-based data that GA4 collects. But we should use other tools and techniques to independently verify our analysis and interpretation of this data.
Why?
I just looked at data in the GA4 demo account of the Google Merchandise Store, and 46,811 of the 68,976 total users over the last 28 days were acquired from the direct channel.
This means 67.9% of users arrived at the site “via a saved link or by entering your URL.”
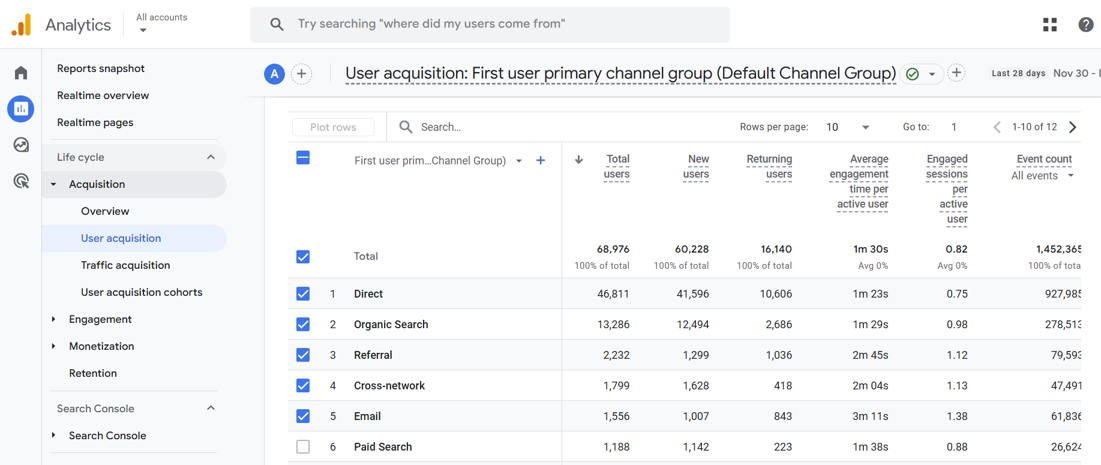 Screenshot from Google Analytics, January 2025
If you think the Google Merchandise Store’s data is an anomaly because it’s from the GA4 demo account, then check your own data.
I did, and 57.6% of my total users arrived through the direct channel. So, your mileage may vary, but there are probably more users than you can shake a stick at.
More importantly, the Google Merchandise Store’s business goal is to sell a variety of Google merchandise, including apparel, accessories, lifestyle products, stationery, and collectibles.
How would you analyze and interpret GA4’s data to determine which marketing efforts were effective?
You could use GA4 to understand how users progress through the online shopping cart. If you notice that users have trouble with a particular step, then you could use conversion rate optimization (CRO) to make changes on the store’s website to resolve the problem.
You would analyze and interpret customer engagement data from the middle and lower parts of the so-called sales funnel.
If I were the owner of a brick-and-mortar store, I’d realize that I’m focusing all my attention on which aisles people walk down and which items they bring to the cash register.
But I still don’t have a clue where they heard about my shop before they walked through the door.
In other words, GA4 gives us less than a third of the data we need to know about user acquisition: The initial stage of building business awareness and acquiring user interest.
Somehow, we’ve missed what GA4 can’t – or doesn’t – tell us about the Zero Moment of Truth (ZMOT): the moment in the purchase process when the consumer or business buyer researches a product or service prior to visiting your website.
The Missing Bullet Holes
Why haven’t we spotted this misalignment before? Well, let me share a story.
My father was a sergeant in the United States Army Air Corps (USAAC) during World War II.
When I started conducting market research in the mid-1980s – when he was the director of marketing at Oldsmobile, and I was the director of corporate communications at Lotus Development Corporation – he told me a story that has since been retold in “Abraham Wald and the Missing Bullet Holes,” which is an excerpt from How Not To Be Wrong by Jordan Ellenberg.
During World War II, officers in the USAAC asked Abraham Wald, one of the smartest statisticians in the Statistical Research Group (SRG), to analyze some classified data.
When American bombers came back from missions over Europe, they were covered in bullet holes.
“But the damage wasn’t uniformly distributed across the aircraft,” Ellenberg notes. “There were more bullet holes in the fuselage, not so many in the engines.”
Wald recognized that the planes that came back were not a random sample of all the planes that had been sent on bombing missions, and he also realized the damage should have been spread equally among all the bombers.
So, he asked, “Where are the missing holes?” Ellenberg explains, “The reason planes were coming back with fewer hits to the engine is that planes that got hit in the engine weren’t coming back.”
The Missing Holes In User Acquisition
Digital marketers are in an analogous situation. GA4 provides us with so much event-based data that we’ve failed to spot the missing holes in user acquisition.
So, now that we realize that we don’t have a clue about where the lion’s share of our audience discovered our brand or product before visiting our website, what should we do?
We should conduct some audience research that can tell us:
- Who are they? (Demographics: age, gender, location, job, and income).
- What do they do? (Behavior: how they shop, what they search for online).
- Where do they hang out? (Platforms: social media, websites, communities).
- What matters to them? (Needs and Interests: their problems, desires, and what they talk about).
Are there any audience research tools that can help us? Yes, they include:
- SparkToro or Audiense: For demographic and platform data.
- Brandwatch, HootSuite, or Sprout Social: For social listening.
- Ahrefs, Moz, or SpyFu: For keyword research.
- Google Trends or Exploding Topics: For detecting internet search trends.
How Do You Spot The Missing Holes?
If you’re in the initial stage of building business awareness and acquiring user interest in other countries, then how do you spot the missing holes?
For over 10 years, I used the now sunset Google Surveys to answer questions like that. You can still use Google Forms or SurveyMonkey.
I asked survey expert and CEO of Growth Survey Systems Nathaniel Laban if he would provide a sample question for such a survey, and here’s what he sent me via email:
For a consumer or B2B study, it might look like this:
1. Where do you get news and information about (brand/product)? (Select all that apply. Multiple response.)
- From friends, family, and colleagues.
- From an expert or enthusiast who demonstrably knows the topic well.
- Organic search.
- Blogs, news sites.
- Paid search.
- Email.
- Organic social.
- Organic shopping.
- Organic video.
- Other (Specify):
Laban added:
“Communications and marketing channels should always be investigated for one’s target audience.
You need to meet people where they are today to be successful in communications and marketing campaigns. Test your assumptions about where your audience is and back it up with statistically representative data.
Trust your math, not your gut!”
What Can You Expect To Discover?
Now that you know how to spot the holes at the top of the funnel where GA4 can’t – or doesn’t – tell us what we need to know about ZMOT, what can you expect to discover?
GA4 provides a way to measure engaged-view key events, which indicate that someone watched a YouTube video for at least 10 seconds and then triggered a key event on your website or app within three days of viewing the video.
Engaged-view key events are a more accurate way to measure the performance of your video ads. They recognize the fact that users often don’t act immediately after seeing an ad, but rather after they’ve finished watching a video.
This also explains why 70% of YouTube viewers say they’ve purchased a brand after discovering it on the platform. It indicates that YouTube is a highly effective medium for brand discovery and purchase intent.
But to measure engaged-view key events, you need to link your Google Ads account to allow data to flow between Ads and GA4.
Unfortunately, there isn’t a similar way to measure engaged-view key events for other default channels in GA4 like organic video (e.g., YouTube or TikTok), organic social (e.g., Facebook or LinkedIn), or referral (e.g., blogs or news sites).
Users actively seek information about products and services by watching or reading this content, often leading to buying decisions based on what they’ve seen and learned in these channels.
But if you conduct an information sources survey and invest in the right channels and sources of influence, then you shouldn’t be shocked to find that you tend to generate more traffic, leads, and sales, too.
Conducting Brand Lift Surveys
What if your company or clients are in the automotive, consumer packaged goods, or retail industries, and your business objective is to raise brand awareness? How do you measure that?
As I mentioned previously, you can conduct Brand Lift surveys.
Either periodically or before and after major campaigns, you can survey your audience and ask:
- Standard Brand Awareness: Have you heard of (brand/product/message)?
- Unaided Brand Awareness: Which of the following (brand/product category) have you heard of? (Tick all that apply.)
- Top-of-Mind Awareness: Which of the following (brand/products) comes to mind first when you think of (statement)?
- Standard Favorability: What’s your opinion of (brand/product)?
- Familiarity: How familiar are you with (brand/product name)?
- Intent: Will you buy (brand) the next time you shop for (category)?
- Action Intent: How likely are you to purchase (brand)?
- Recommendation: Will you recommend (brand/product) to a friend?
- Consideration: How likely are you to (consider) (brand/product) the next time you want to (shop for) (category)?
- Preference: Among the following (brands), which do you prefer most?
In other words, old-school market research can measure Brand Lift, which GA4’s event-based data can’t – even if it’s supplemented with audience research data.
The Lesson We Can Learn From The Missing Bullet Holes
Digital marketers who don’t conduct market research may know what users do when they reach the middle and lower funnel, but they haven’t a clue about why users in the upper funnel aren’t aware of their brand yet or where they can reach them.
That’s the lesson we can learn from “Abraham Wald and the Missing Bullet Holes.” It’s a lesson that my father learned more than 80 years ago, and he shared it with me about 40 years later. Now, I’m sharing it with you.
In short, trust GA4’s data, but verify your analysis and interpretation of it.
More Resources:
- How Google Analytics 4 Uses AI To Enhance Your Marketing Data
- 7 Common Google Analytics 4 Configuration Mistakes To Avoid
- State Of SEO 2025
Featured Image: alphaspirit.it/Shutterstock
