Natural language processing (NLP) is becoming more important than ever for SEO professionals.
It is crucial to start building the skills that will prepare you for all the amazing changes happening around us.
Hopefully, this column will motivate you to get started!
We are going to learn practical NLP while building a simple knowledge graph from scratch.
As Google, Bing, and other search engines use Knowledge Graphs to encode knowledge and enrich search results, what better way to learn about them than to build one?
Specifically, we are going to extract useful facts automatically from Search Engine Journal XML sitemaps.
In order to do this and keep things simple and fast, we will pull article headlines from the URLs in the XML sitemaps.
We will extract named entities and their relationships from the headlines.
Finally, we will build a powerful knowledge graph and visualize the most popular relationships.
In the example below the relationship is “launches.”
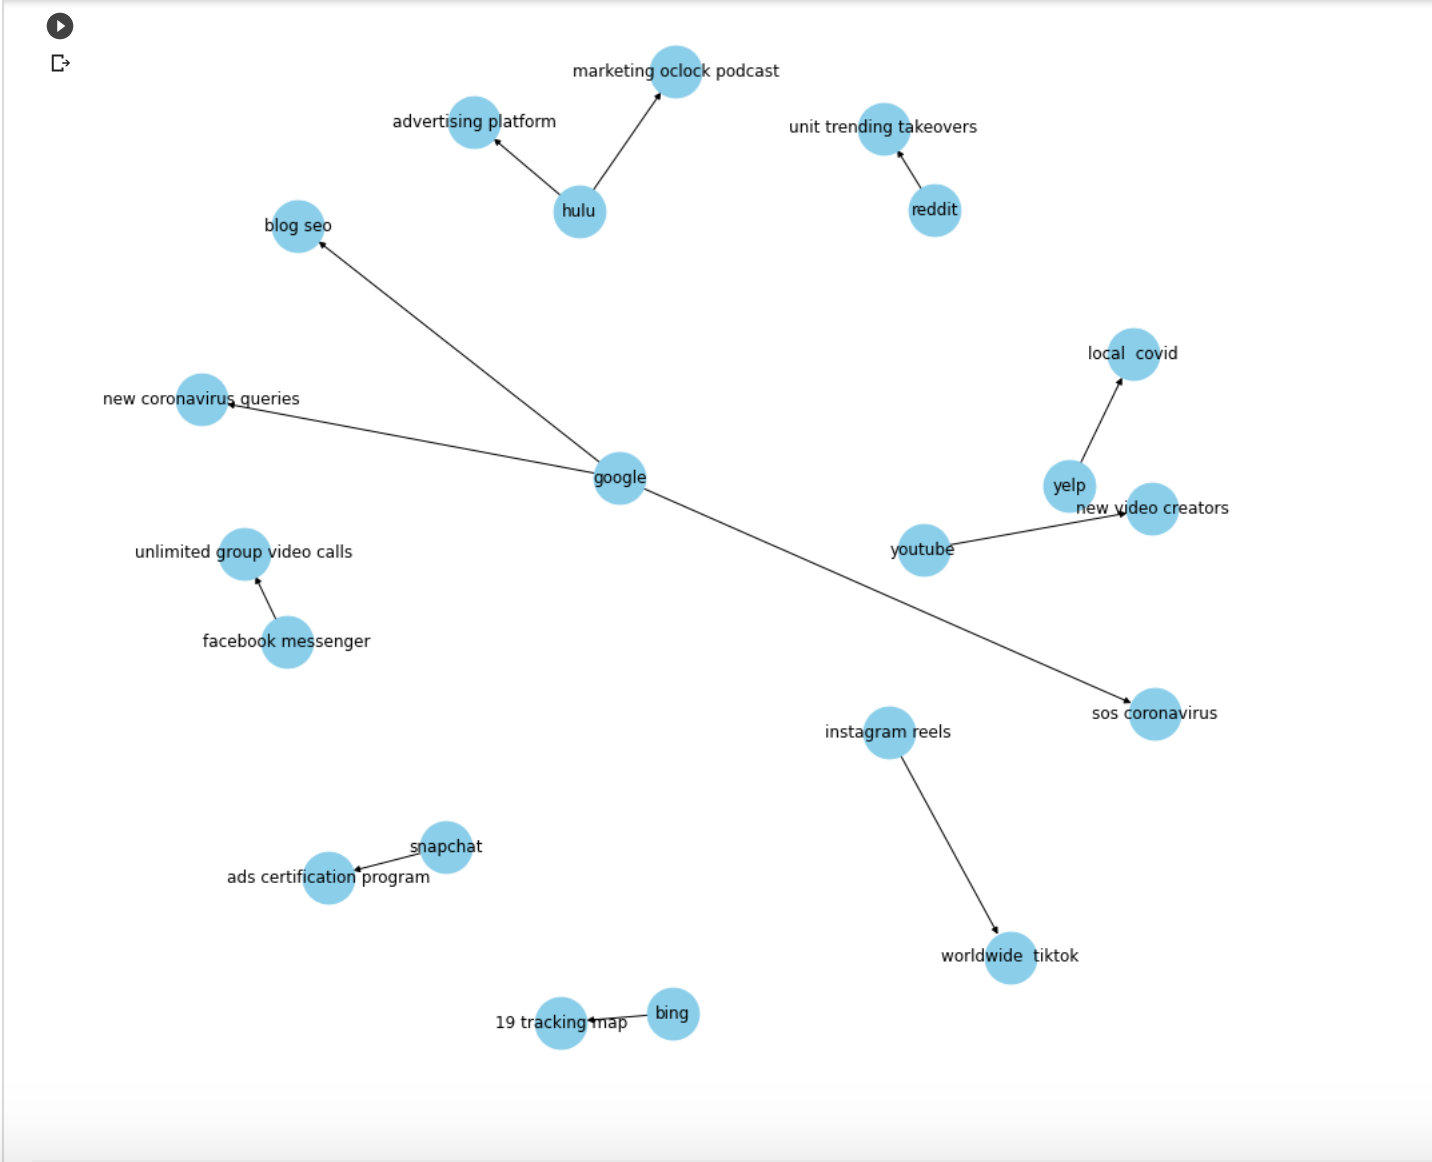
The way to read the graph is to follow the direction of the arrows: subject “launches” object.
For example:
- “Bing launches 19 tracking map”, which is likely “Bing launches covid-19 tracking map.”
- Another is “Snapchat launches ads certification program.”
These facts and over a thousand more were extracted and grouped automatically!
Let’s get in on the fun.
Here is the technical plan:
- We will fetch all Search Engine Journal XML sitemaps.
- We will parse the URLs to extract the headlines from the slugs.
- We will extract entity pairs from the headlines.
- We will extract the corresponding relationships.
- We will build a knowledge graph and create a simple form in Colab to visualize the relationships we are interested in.
Fetching All Search Engine Journal XML Sitemaps
I recently had an enlightening conversation with Elias Dabbas from The Media Supermarket and learned about his wonderful Python library for marketers: advertools.
Some of my old Search Engine Journal articles are not working with the newer library versions. He gave me a good idea.
If I print the versions of third-party libraries now, it would be easy to get the code to work in the future.
I would just need to install the versions that worked when they fail. 🤓
%%capture

!pip install advertools
import advertools as adv

print(adv.__version__)

#0.10.6
We are going to download all Search Engine Journal sitemaps to a pandas data frame with two lines of code.
sitemap_url = "https://www.searchenginejournal.com/sitemap_index.xml"
df= adv.sitemap_to_df(sitemap_url)
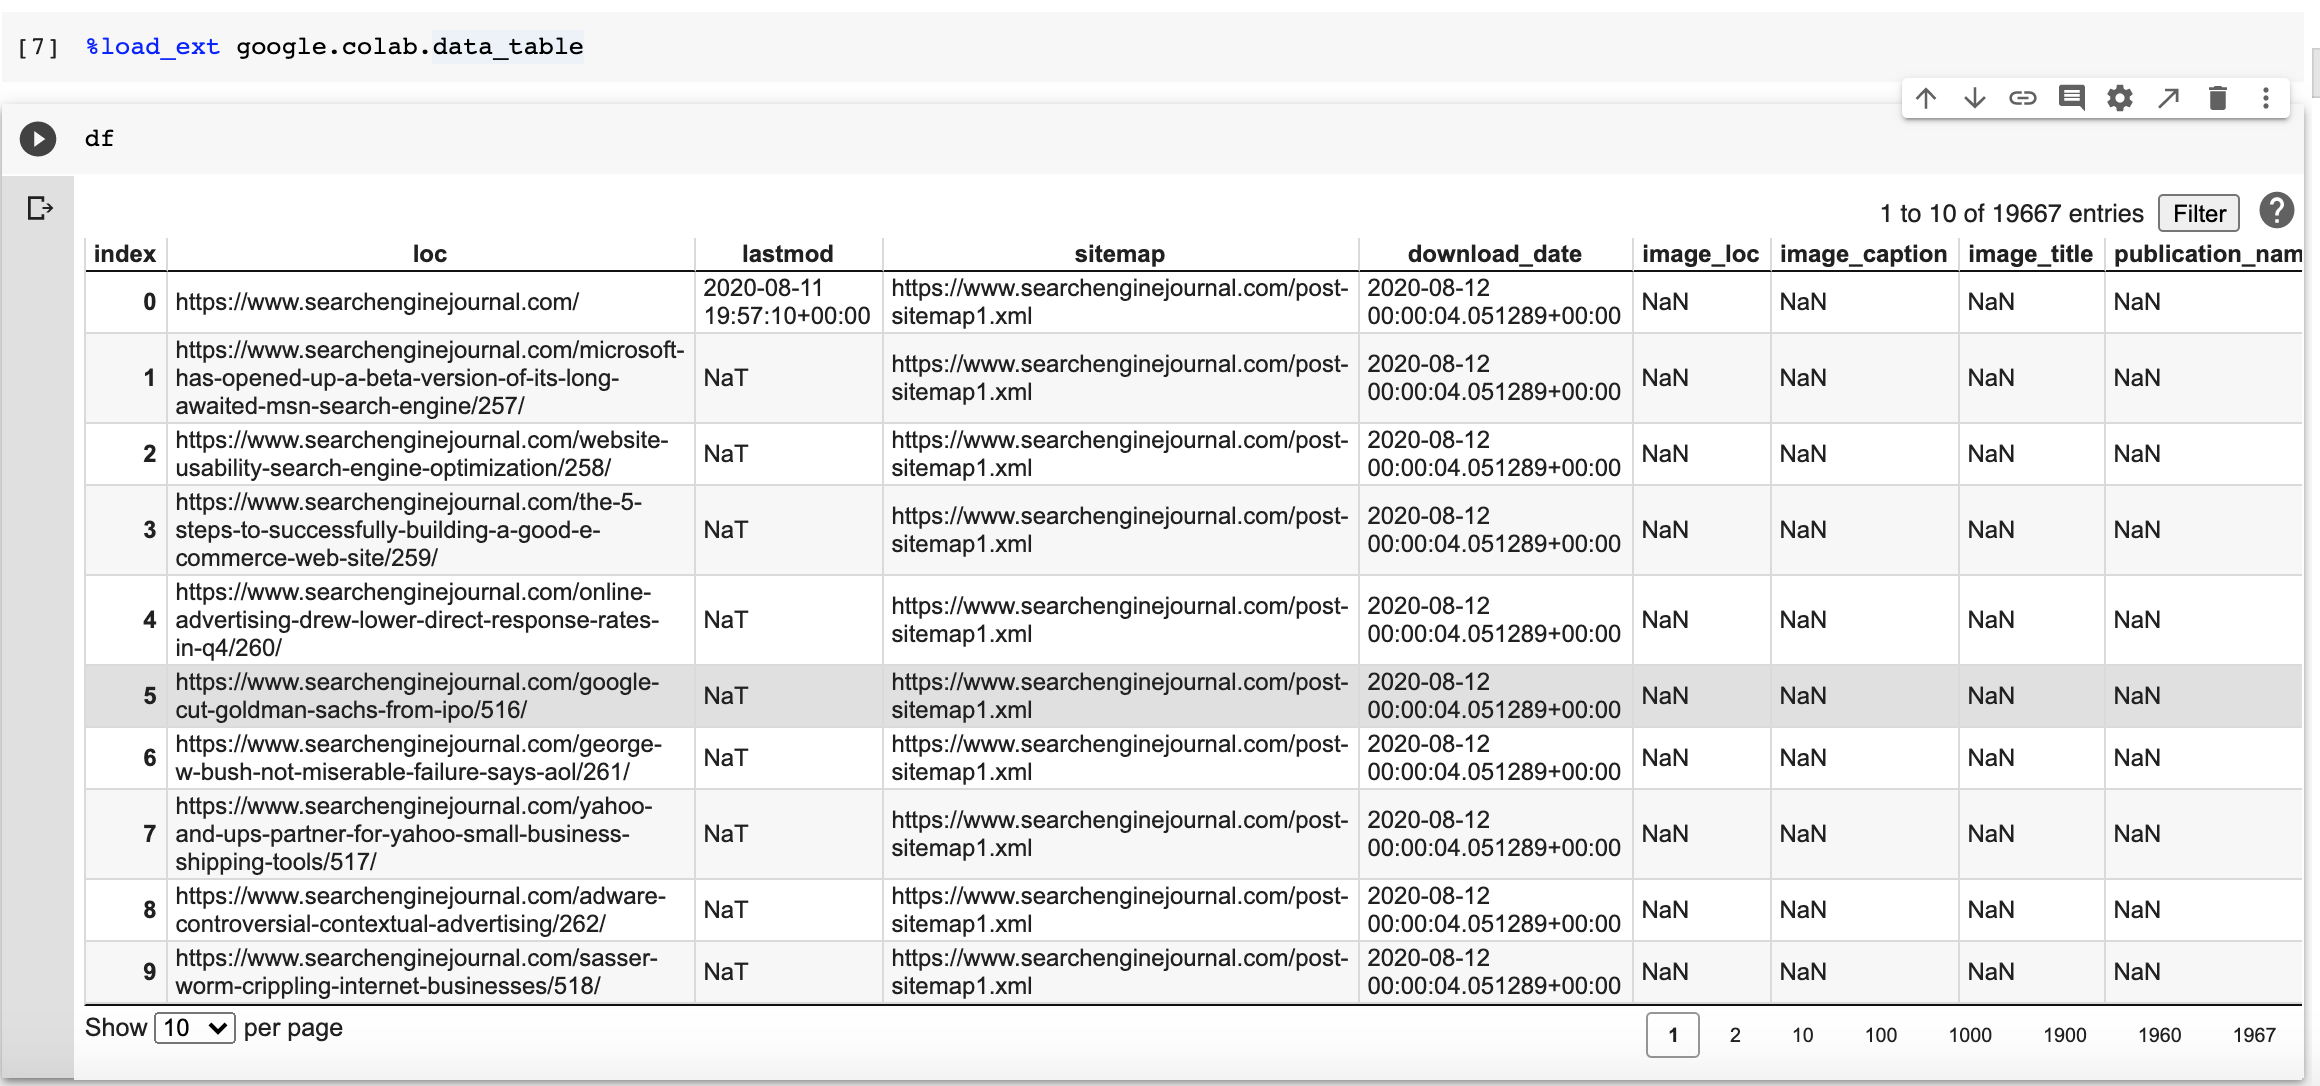
One cool feature in the package is that it downloaded all the linked sitemaps in the index and we get a nice data frame.
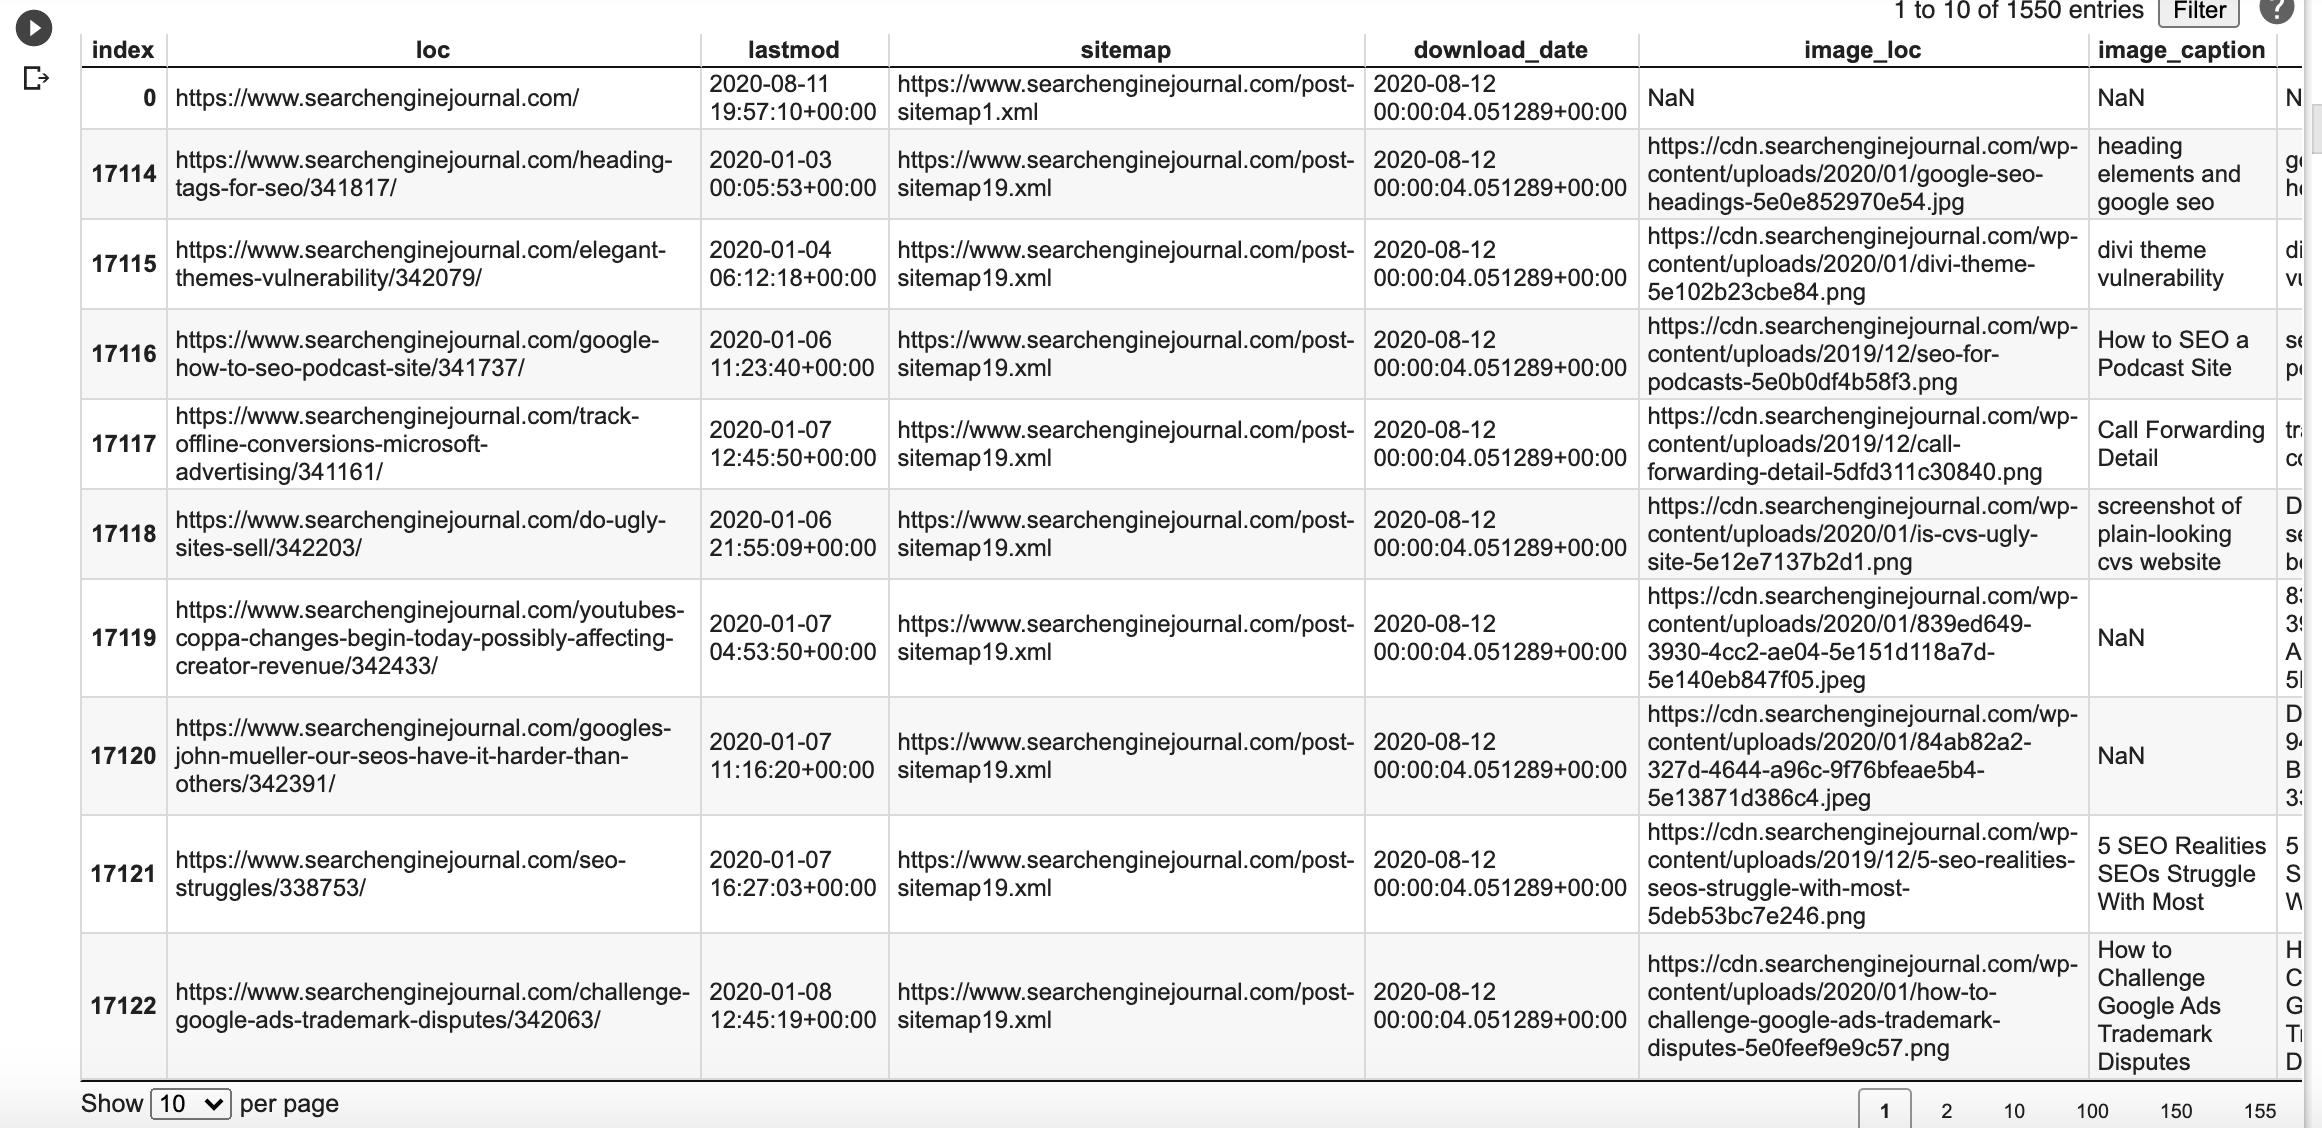
Look how simple it is to filter articles/pages from this year. We have 1,550 articles.
df[df["lastmod"] > '2020-01-01']
Extract Headlines From the URLs
The advertools library has a function to break URLs within the data frame, but let’s do it manually to get familiar with the process.
from urllib.parse import urlparse

import re
example_url="https://www.searchenginejournal.com/google-be-careful-relying-on-3rd-parties-to-render-website-content/376547/"
u = urlparse(example_url)
print(u) #output -> ParseResult(scheme='https', netloc='www.searchenginejournal.com', path='/google-be-careful-relying-on-3rd-parties-to-render-website-content/376547/', params='', query='', fragment='')
Here we get a named tuple, ParseResult, with a breakdown of the URL components.
We are interested in the path.
We are going to use a simple regex to split it by / and – characters
slug = re.split("[/-]", u.path)

print(slug)
#output

['', 'google', 'be', 'careful', 'relying', 'on', '3rd', 'parties', 'to', 'render', 'website', 'content', '376547', '']
Next, we can convert it back to a string.
headline = " ".join(slug)

print(headline)
#output
' google be careful relying on 3rd parties to render website content 376547 '
The slugs contain a page identifier that is useless for us. We will remove with a regex.
headline = re.sub("\d{6}", "",headline)

print(headline)
#output

' google be careful relying on 3rd parties to render website content '


#Strip whitespace at the borders
headline = headline.strip()
print(headline)
#output

'google be careful relying on 3rd parties to render website content'
Now that we tested this, we can convert this code to a function and create a new column in our data frame.
def get_headline(url):

  u = urlparse(url)

  if len(u.path) > 1:

    slug = re.split("[/-]", u.path)

    new_headline = re.sub("\d{6}", ""," ".join(slug)).strip()

    #skip author and category pages

    if not re.match("author|category", new_headline):

      return new_headline

  return ""
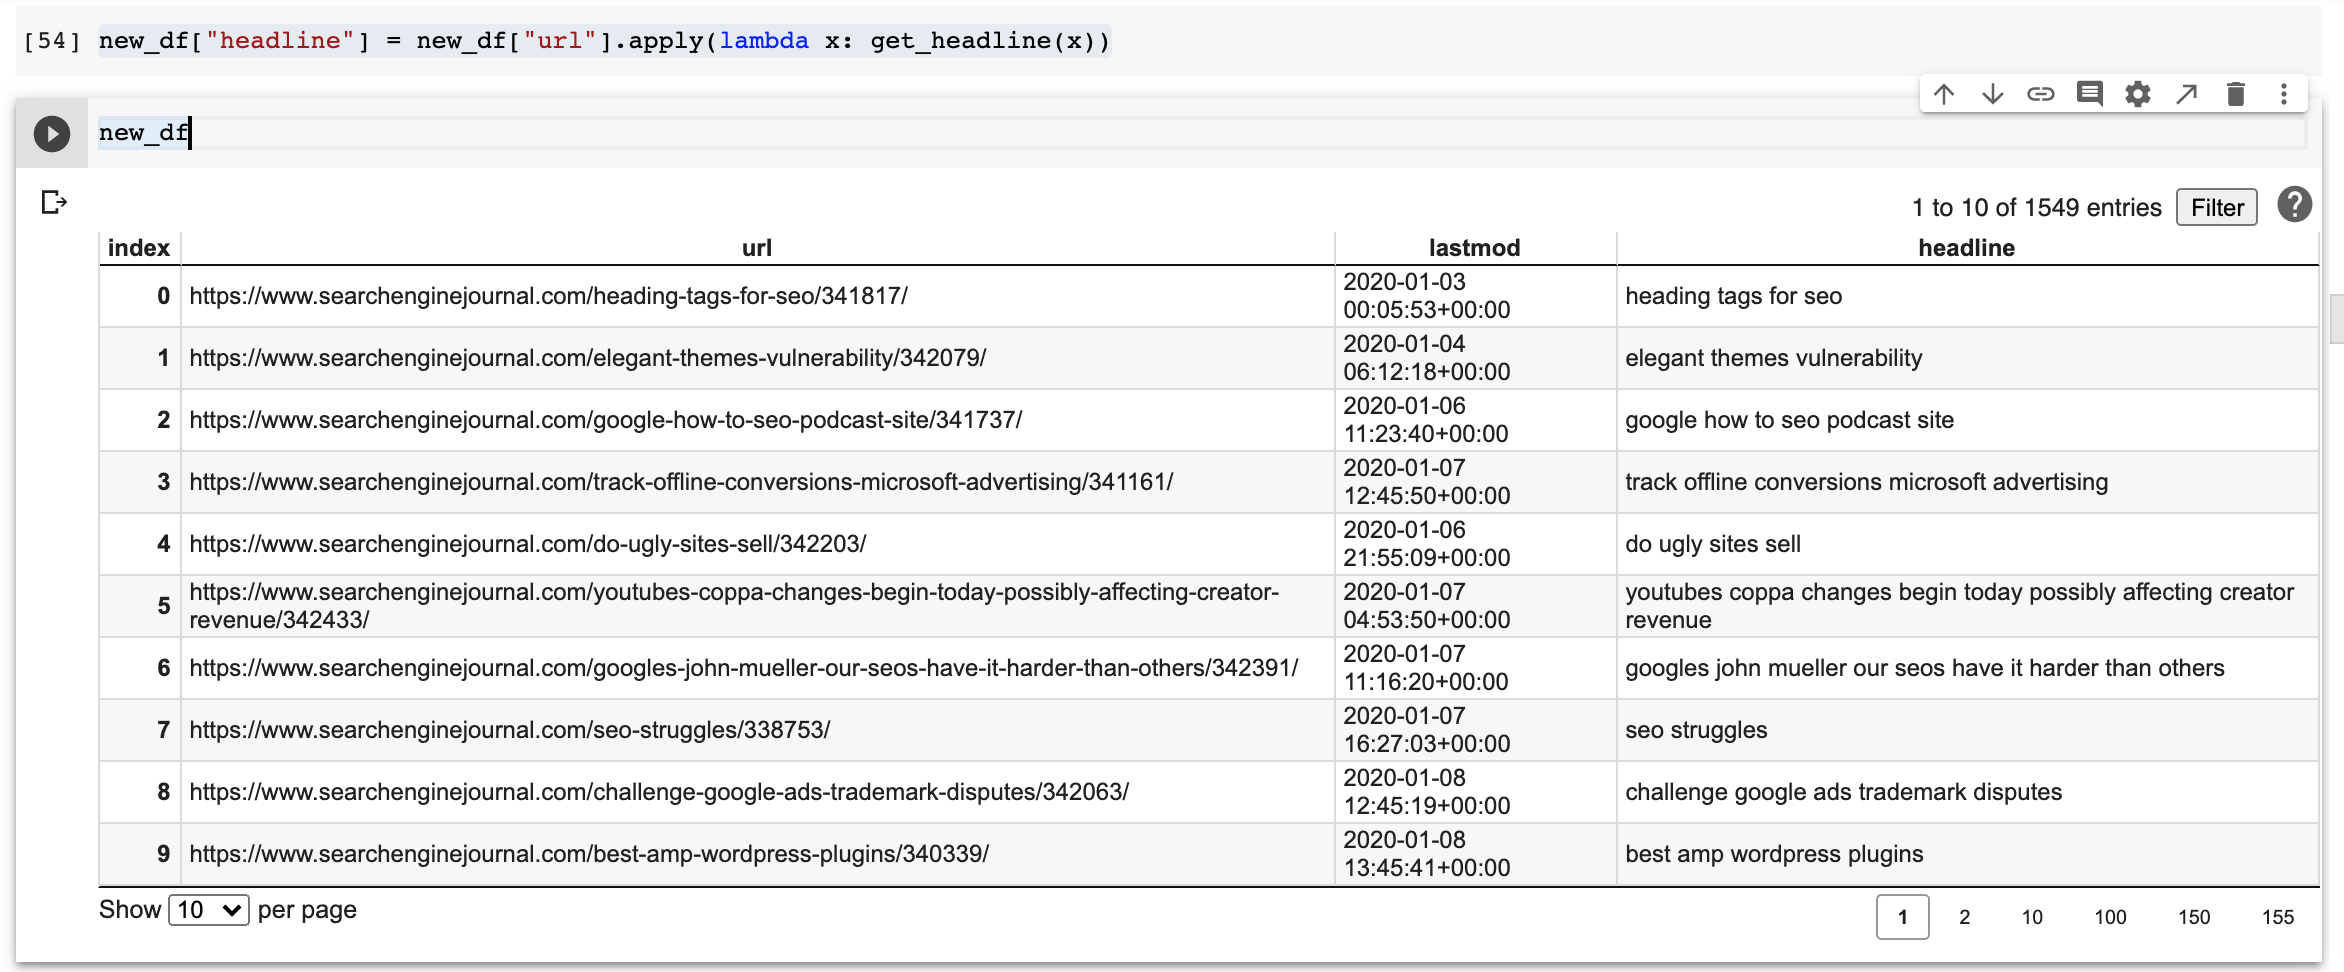
Let’s create a new column named headline.
new_df["headline"] = new_df["url"].apply(lambda x: get_headline(x))
Extracting Named Entities
Let’s explore and visualize the entities in our headlines corpus.
First, we combine them into a single text document.
import spacy

from spacy import displacy

text = "\n".join([x for x in new_df["headline"].tolist() if len(x) > 0])

nlp = spacy.load("en_core_web_sm")

doc = nlp(text)

displacy.render(doc, style="ent", jupyter=True)
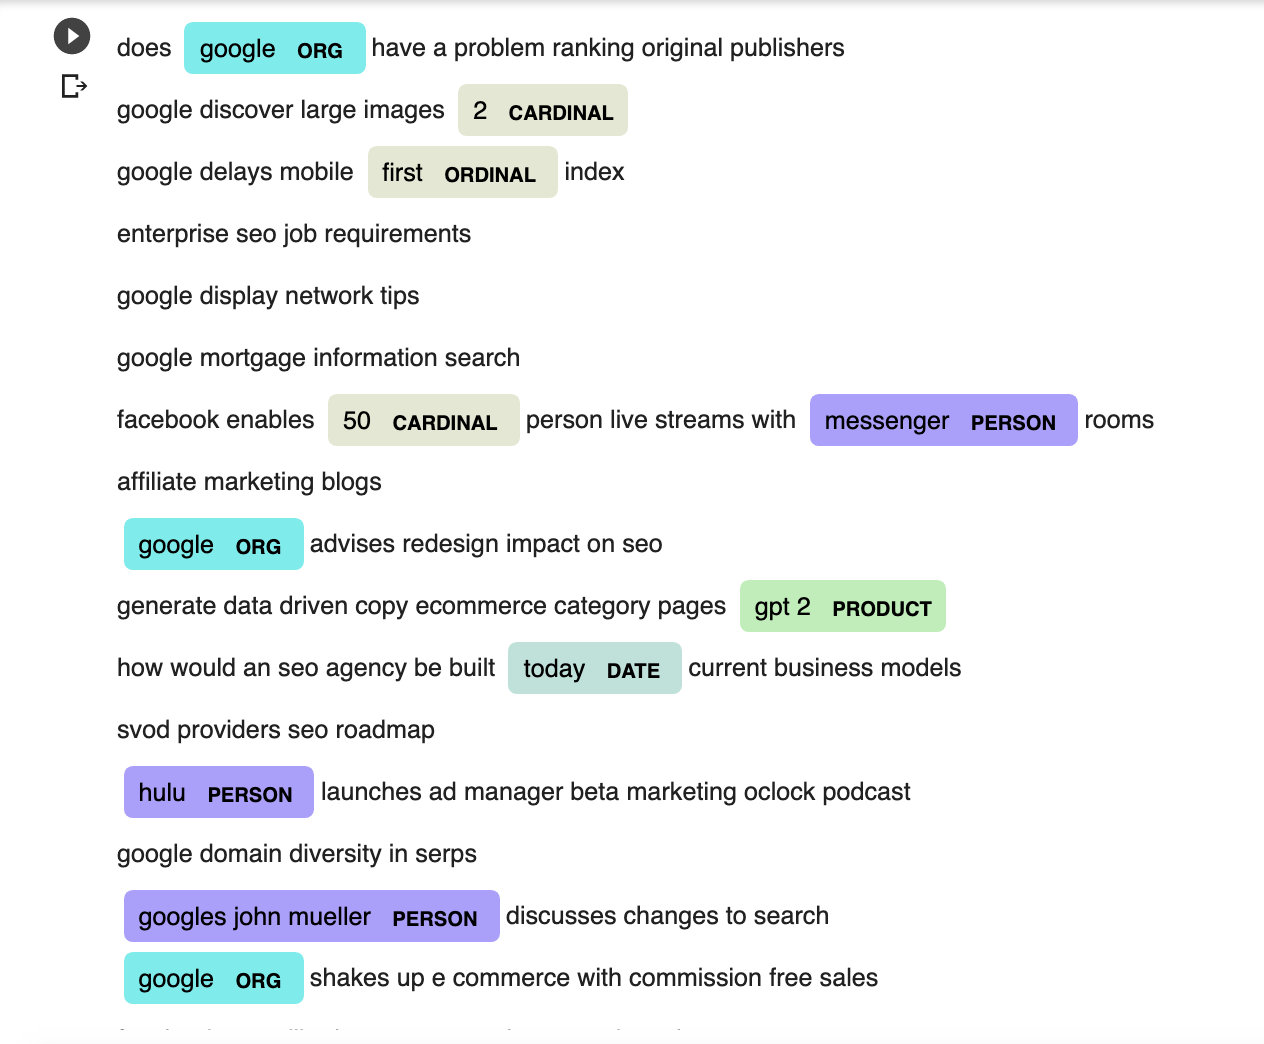
We can see some entities correctly labeled and some incorrectly labeled like Hulu as a person.
There are also several missed like Facebook and Google Display Network.
spaCy‘s out of the box NER is not perfect and generally needs training with custom data to improve detection, but this is good enough to illustrate the concepts in this tutorial.
Building a Knowledge Graph
Now, we get to the exciting part.
Let’s start by evaluating the grammatical relationships between the words in each sentence.
We do this by printing the syntactic dependency of the entities.
for tok in doc[:100]:

  print(tok.text, "...", tok.dep_)
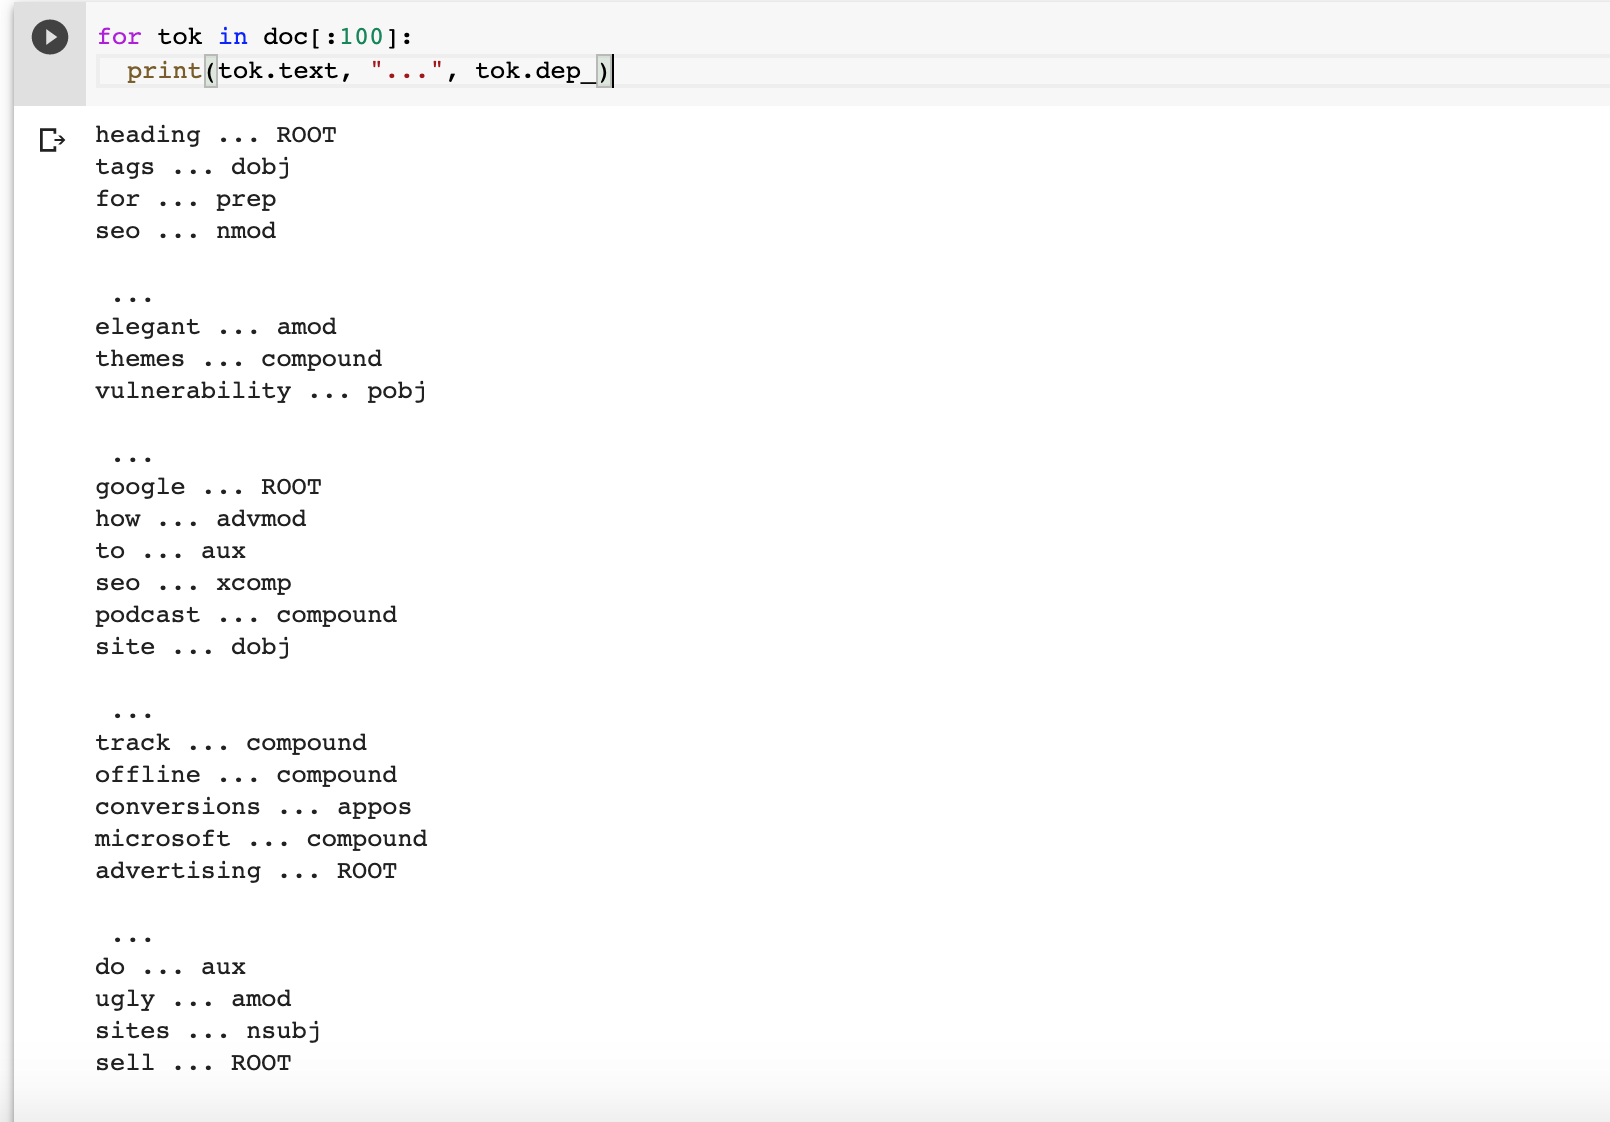
We are looking for subjects and objects connected by a relationship.
We will use spaCy’s rule-based parser to extract subjects and objects from the headlines.
The rule can be something like this:
Extract the subject/object along with its modifiers, compound words and also extract the punctuation marks between them.
Let’s first import the libraries that we will need.
from spacy.matcher import Matcher

from spacy.tokens import Span

import networkx as nx

import matplotlib.pyplot as plt

from tqdm import tqdm
To build a knowledge graph, the most important things are the nodes and the edges between them.
The main idea is to go through each sentence and build two lists. One with the entity pairs and another with the corresponding relationships.
We are going to borrow a couple of functions created by Data Scientist, Prateek Joshi.
- The first one, get_entities extracts the main entities and associated attributes.
- The second one, get_relations extracts the corresponding relationships between entities.
Let’s test them on 100 sentences and see what the output looks like. I added len(x) > 0 to skip empty lines.
for t in [x for x in new_df["headline"].tolist() if len(x) > 0][:100]:

  print(get_entities(t))
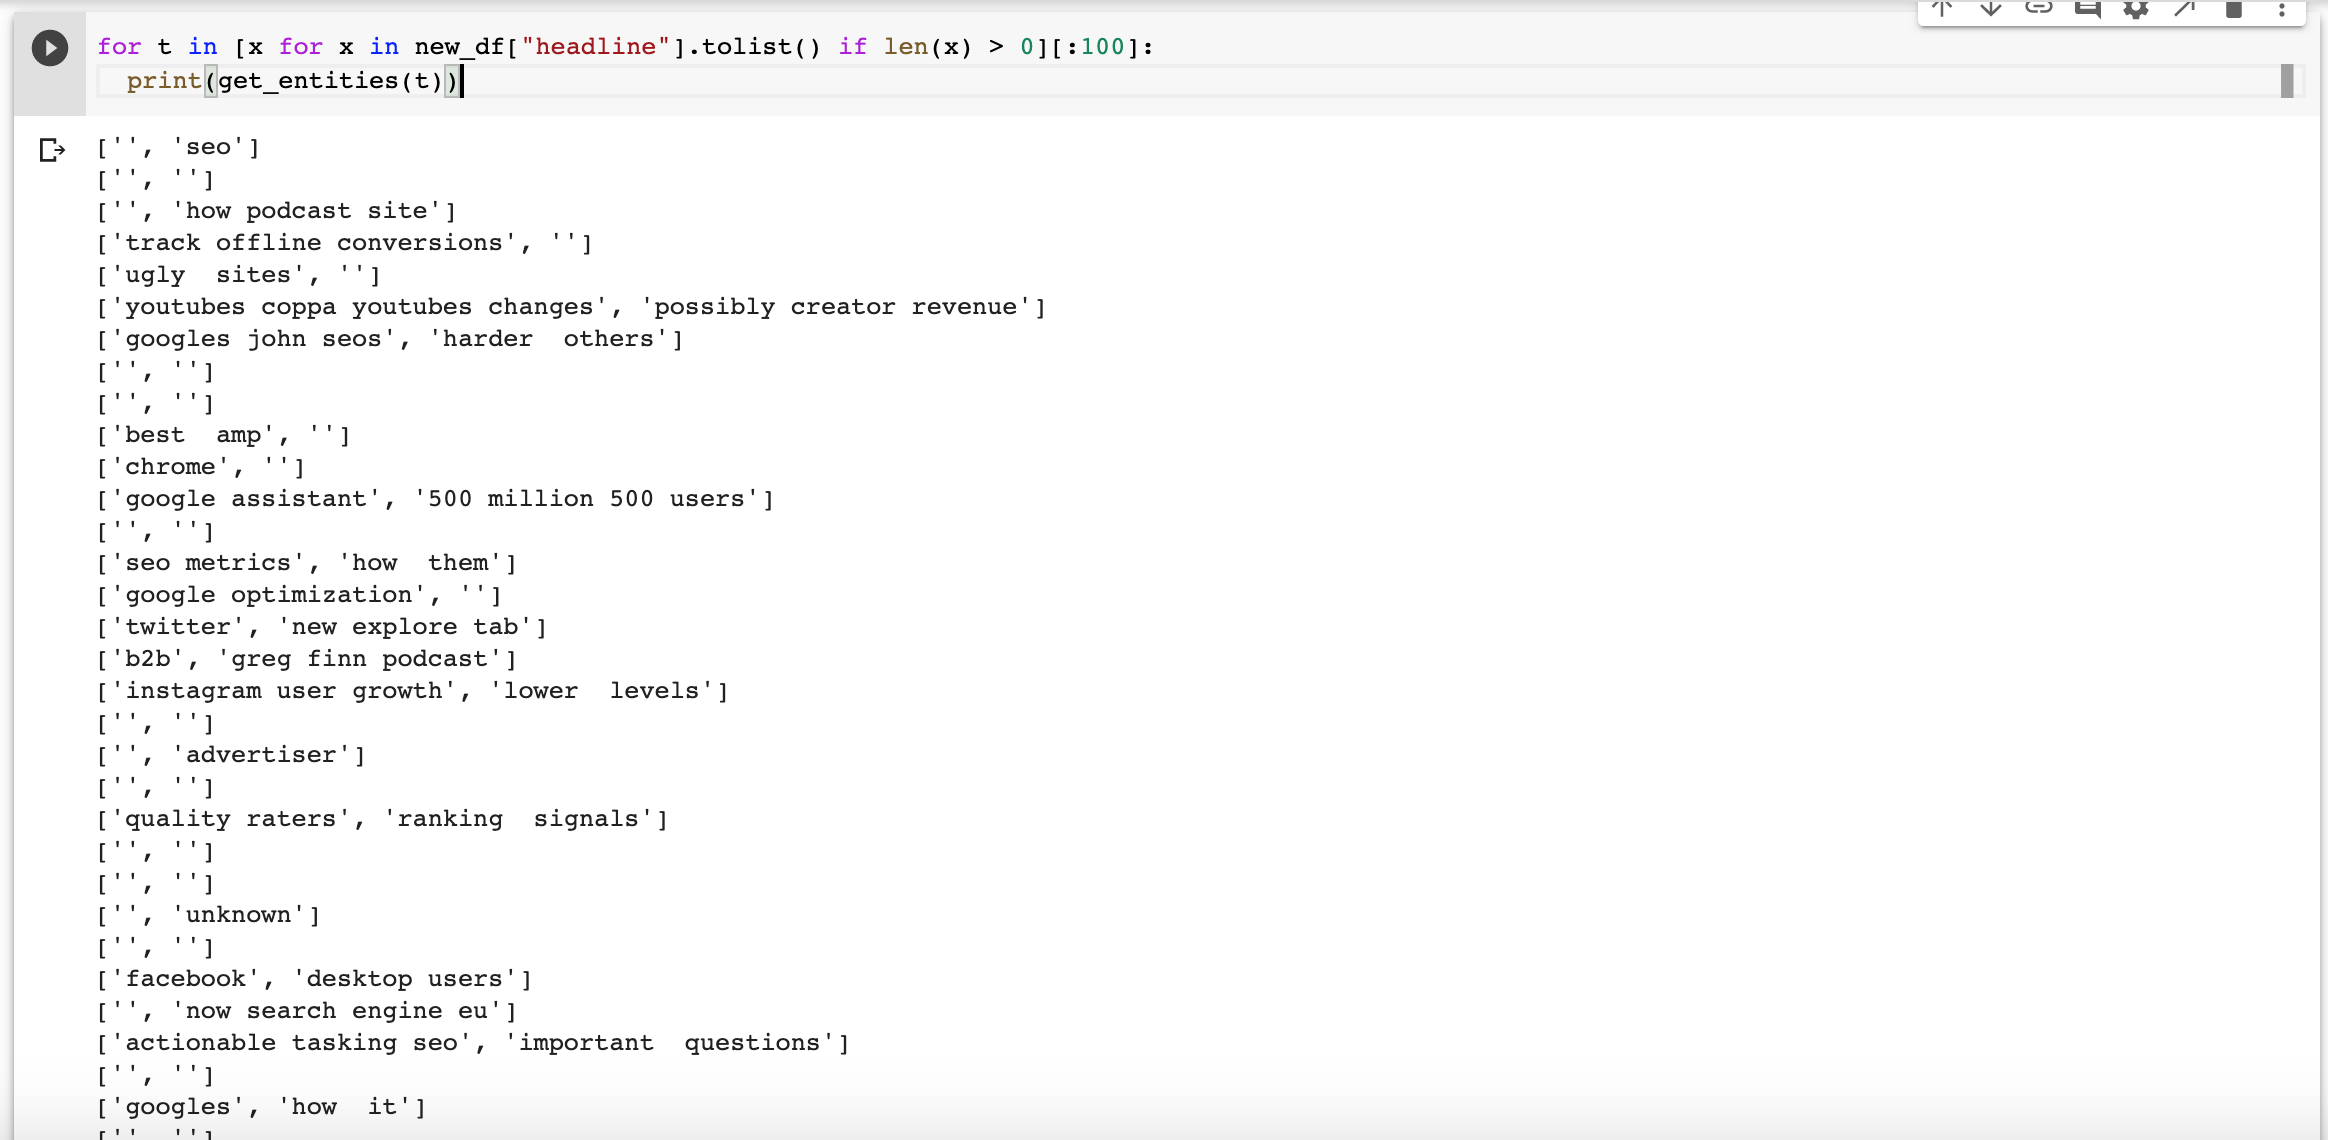
Many extractions are missing elements or are not great, but as we have so many headlines, we should be able to extract useful facts anyways.
Now, let’s build the graph.
entity_pairs = []

for i in tqdm([x for x in new_df["headline"].tolist() if len(x) > 0]):

  entity_pairs.append(get_entities(i))
Here are some example pairs.
entity_pairs[10:20]
#output

[['chrome', ''], ['google assistant', '500 million 500 users'], ['', ''], ['seo metrics', 'how them'], ['google optimization', ''], ['twitter', 'new explore tab'], ['b2b', 'greg finn podcast'], ['instagram user growth', 'lower levels'], ['', ''], ['', 'advertiser']]
Next, let’s build the corresponding relationships. Our hypothesis is that the predicate is actually the main verb in a sentence.
relations = [get_relation(i) for i in tqdm([x for x in new_df["headline"].tolist() if len(x) > 0])]
print(relations[10:20])

#output
['blocker', 'has', 'conversions', 'reports', 'ppc', 'rolls', 'paid', 'drops to lower', 'marketers', 'facebook']
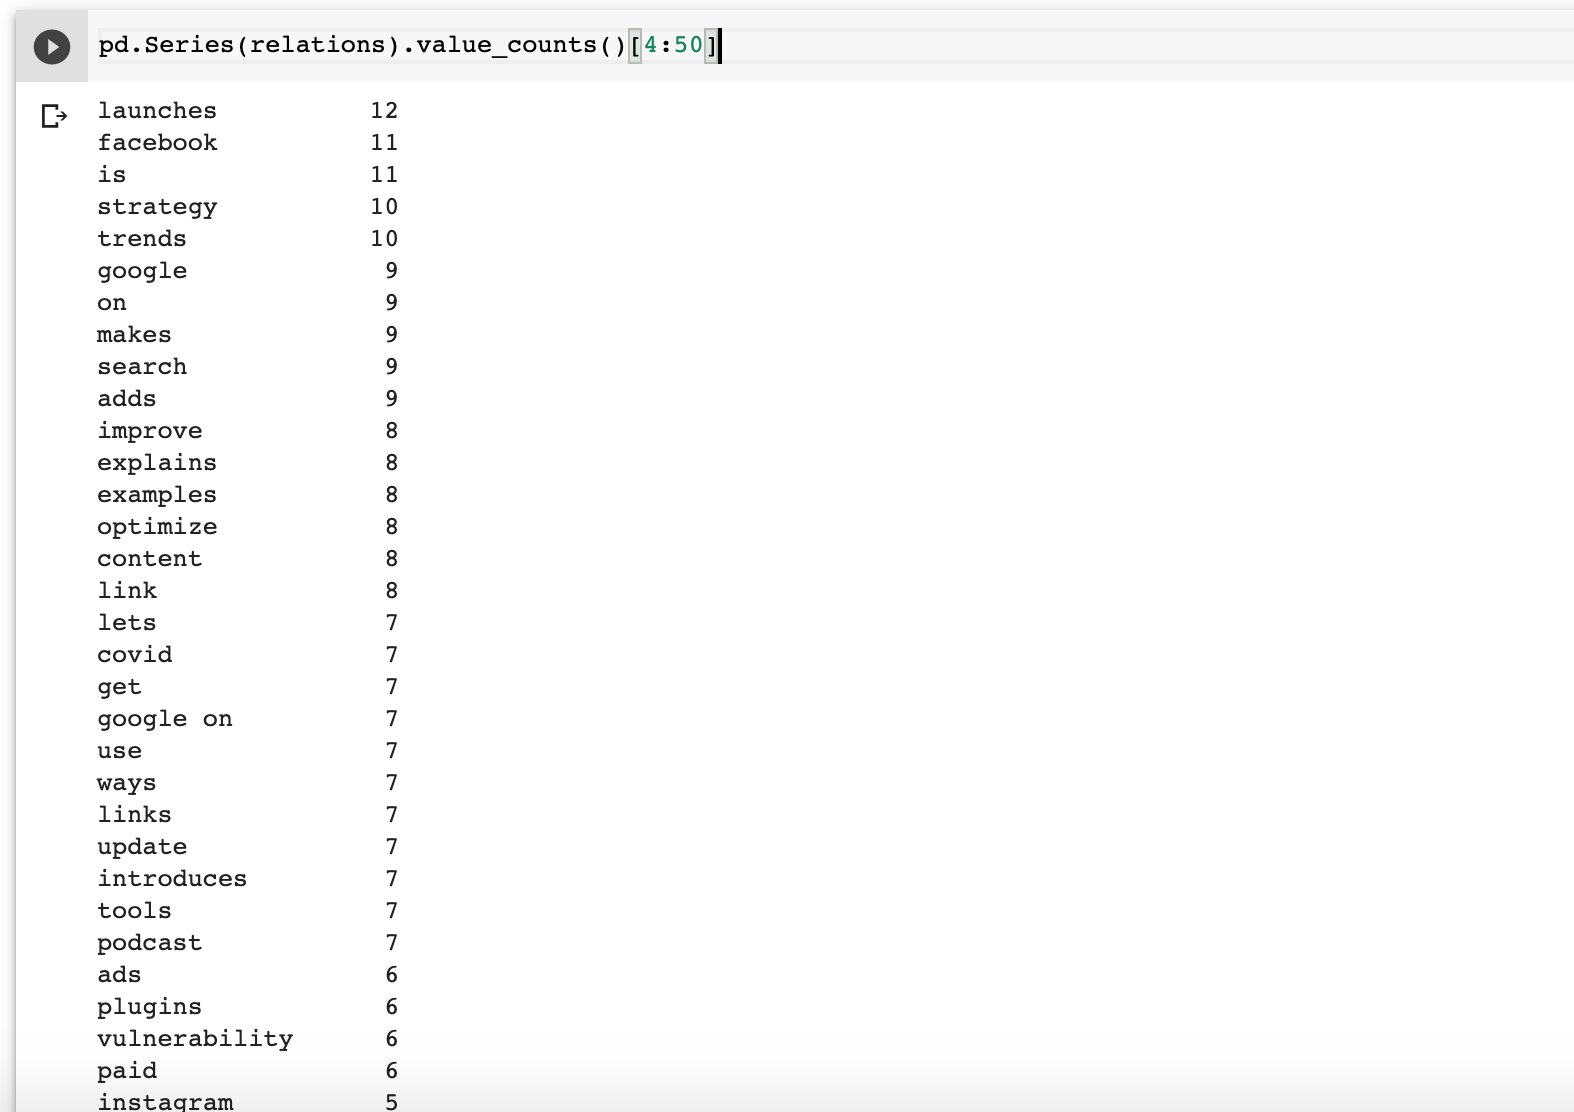
Next, let’s rank the relationships.
pd.Series(relations).value_counts()[4:50]
Finally, let’s build the knowledge graph.
# extract subject

source = [i[0] for i in entity_pairs]

# extract object

target = [i[1] for i in entity_pairs]

kg_df = pd.DataFrame({'source':source, 'target':target, 'edge':relations})
# create a directed-graph from a dataframe

G=nx.from_pandas_edgelist(kg_df, "source", "target",

edge_attr=True, create_using=nx.MultiDiGraph())
plt.figure(figsize=(12,12))

pos = nx.spring_layout(G)

nx.draw(G, with_labels=True, node_color='skyblue', edge_cmap=plt.cm.Blues, pos = pos)

plt.show()
This plots a monster graph, which, while impressive, is not particularly useful.
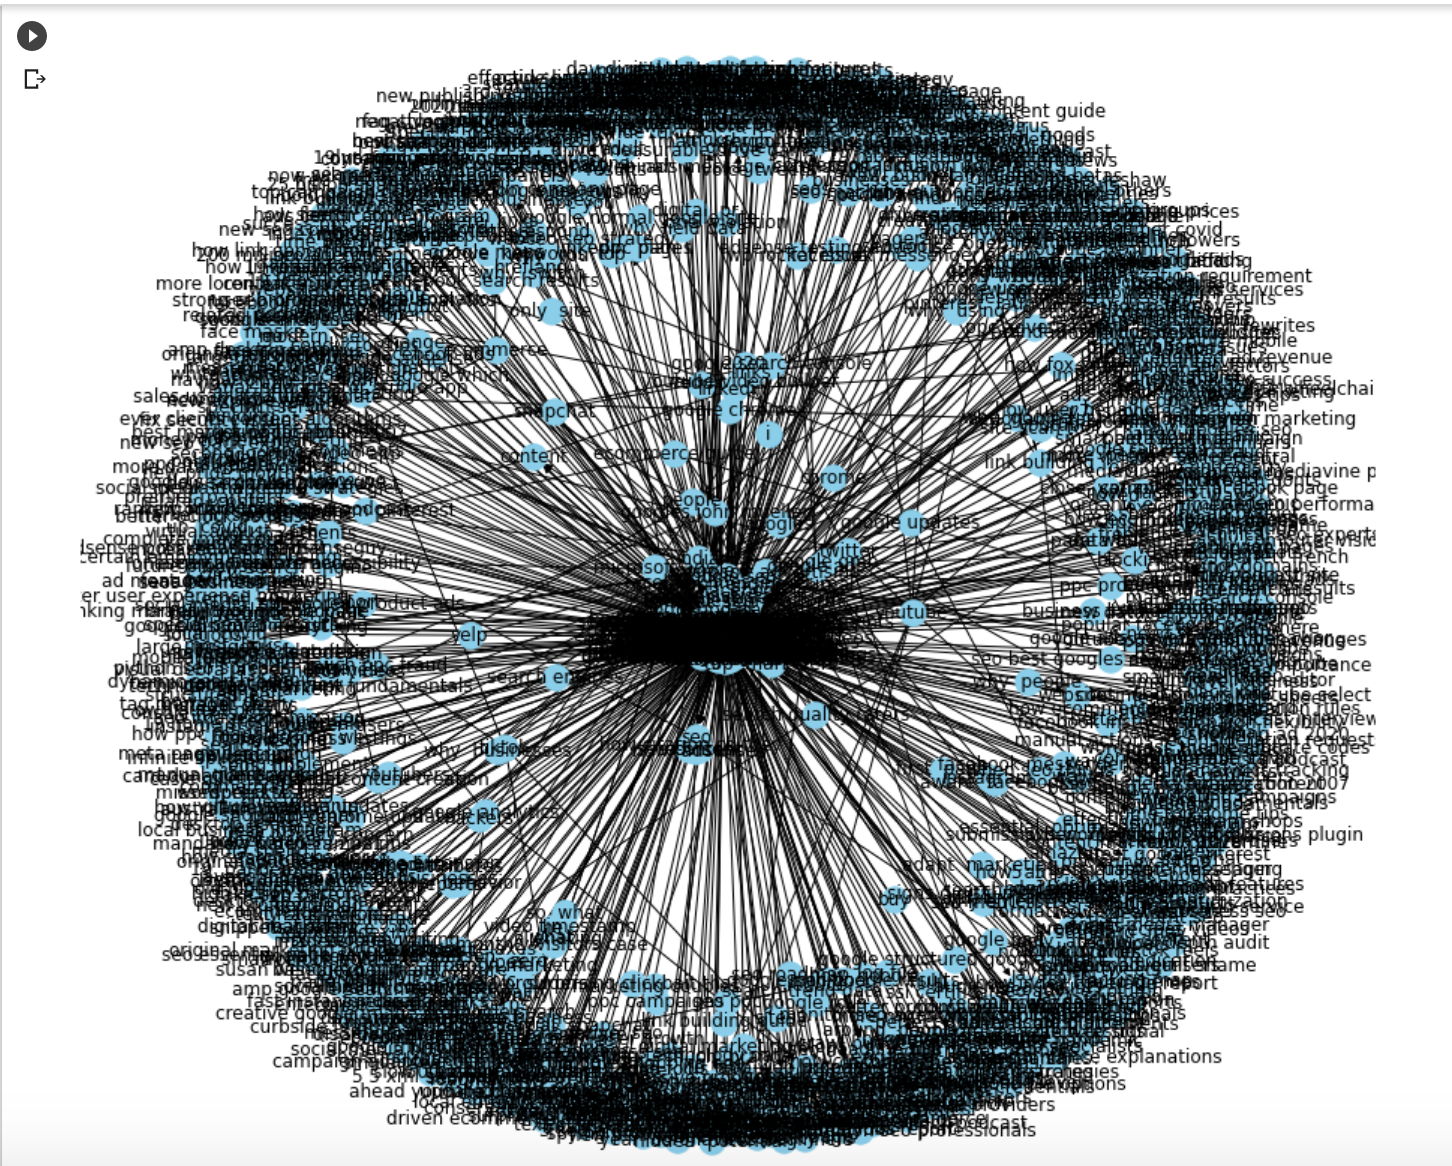
Let’s try again, but take only one relationship at a time.
In order to do this, we will create a function that we pass the relationship text as input (bolded text).
def display_graph(relation):

  G=nx.from_pandas_edgelist(kg_df[kg_df['edge']==relation], "source", "target",

                            edge_attr=True, create_using=nx.MultiDiGraph())

  plt.figure(figsize=(12,12))

  pos = nx.spring_layout(G, k = 0.5) # k regulates the distance between nodes

  nx.draw(G, with_labels=True, node_color='skyblue', node_size=1500, edge_cmap=plt.cm.Blues, pos = pos)

  plt.show()
Now, when I run display_graph("launches"), I get the graph at the beginning of the article.
Here are a few more relationships that I plotted.
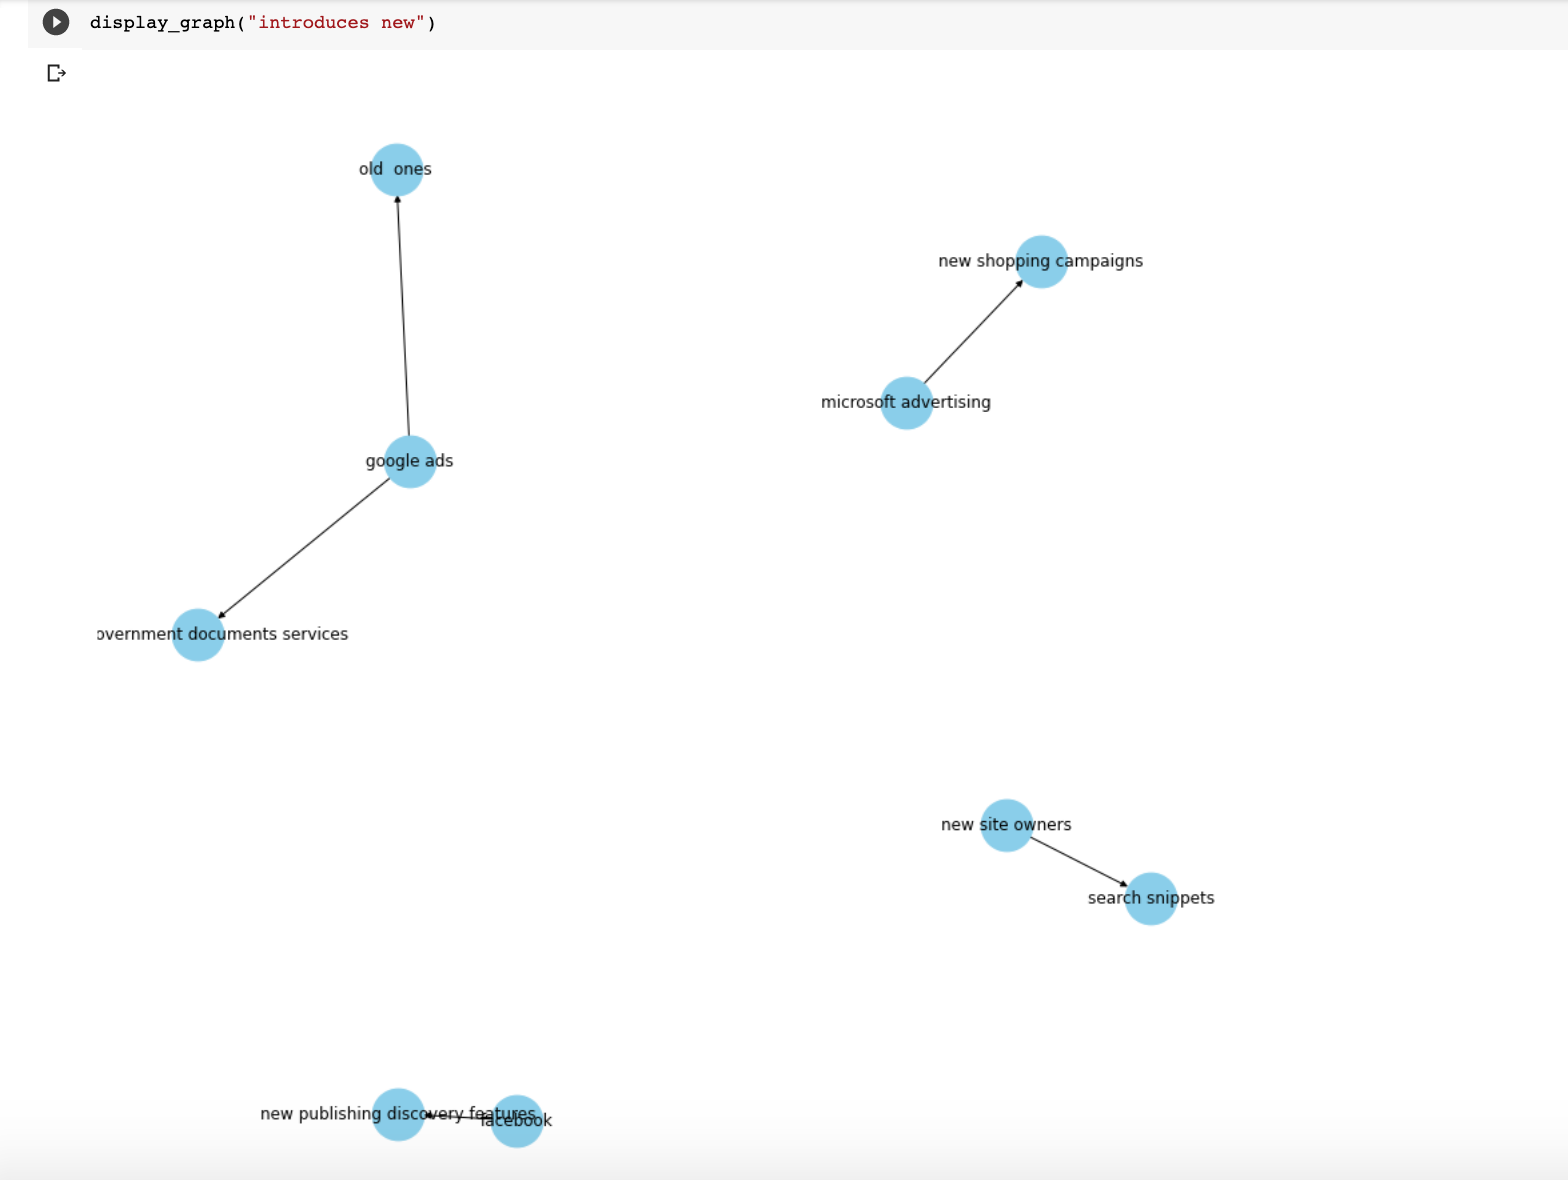
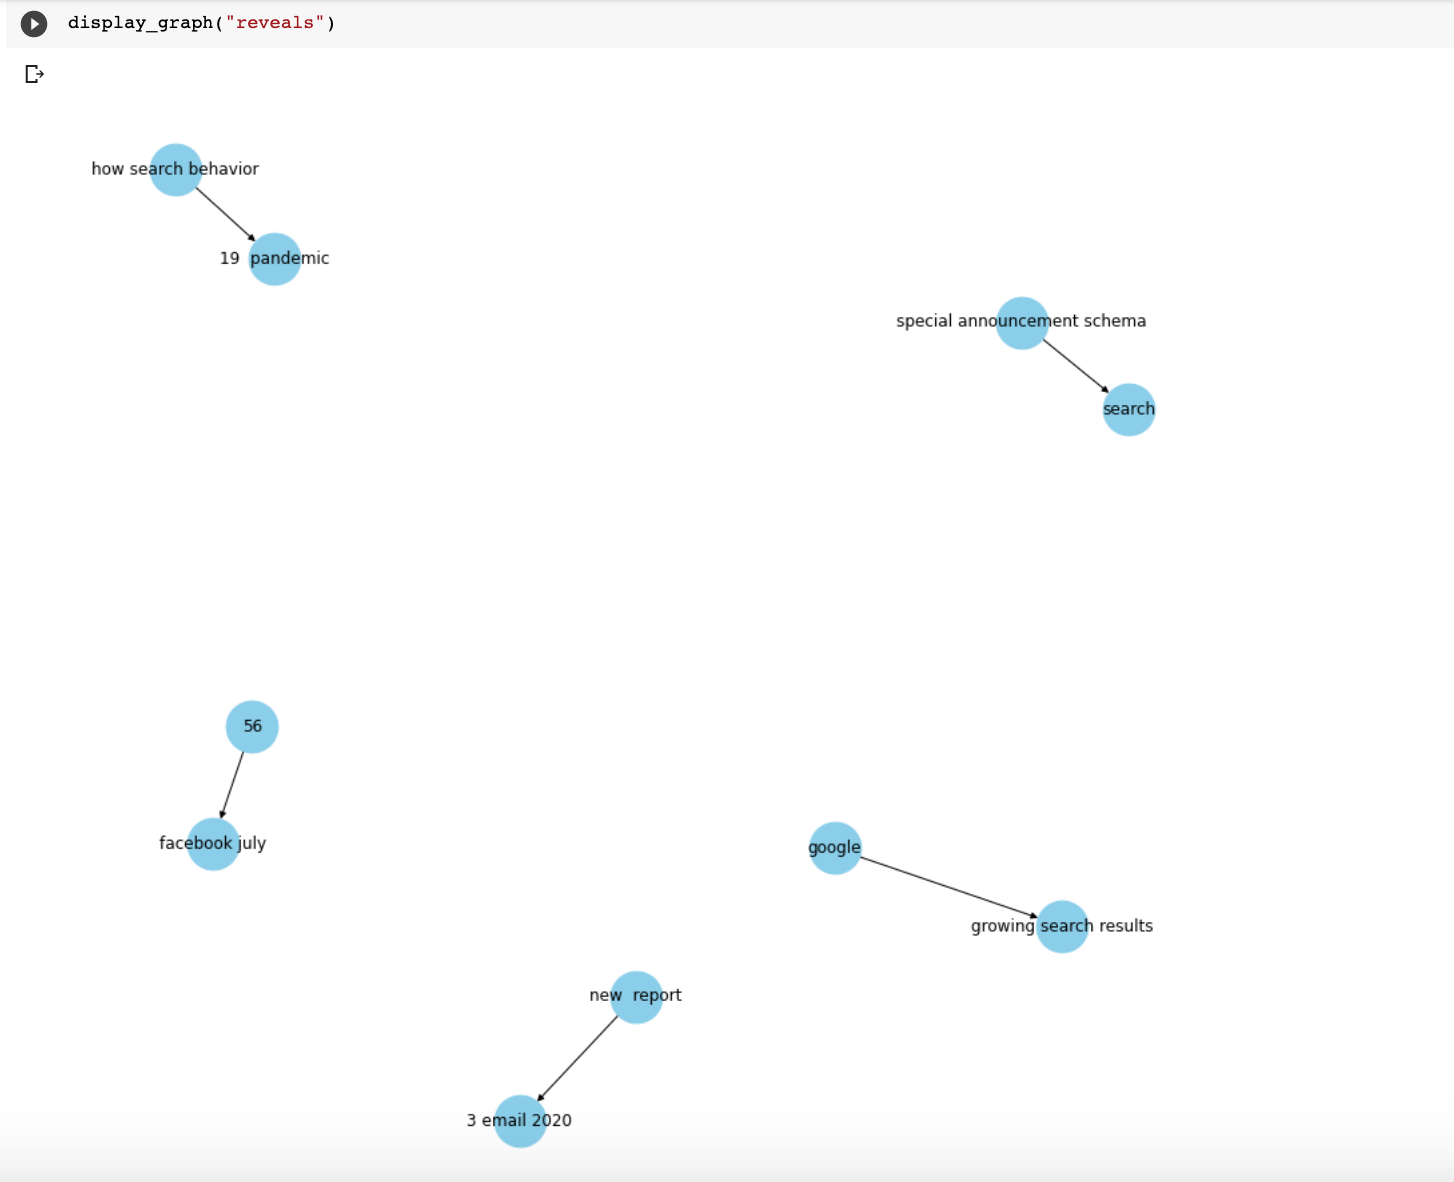
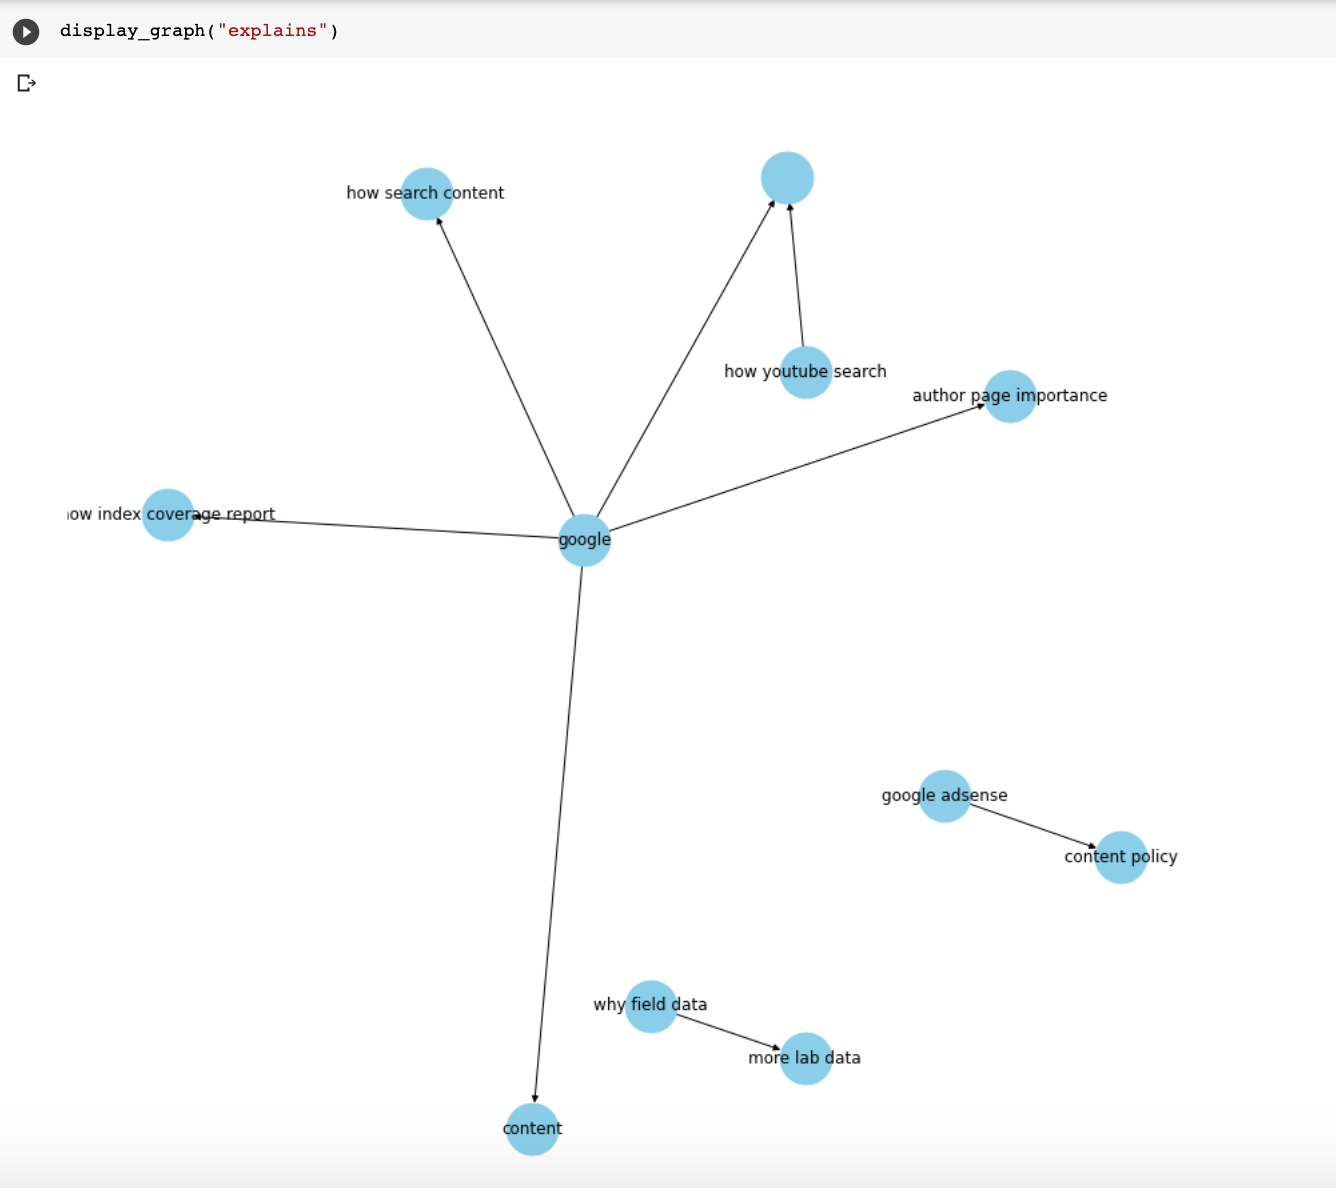
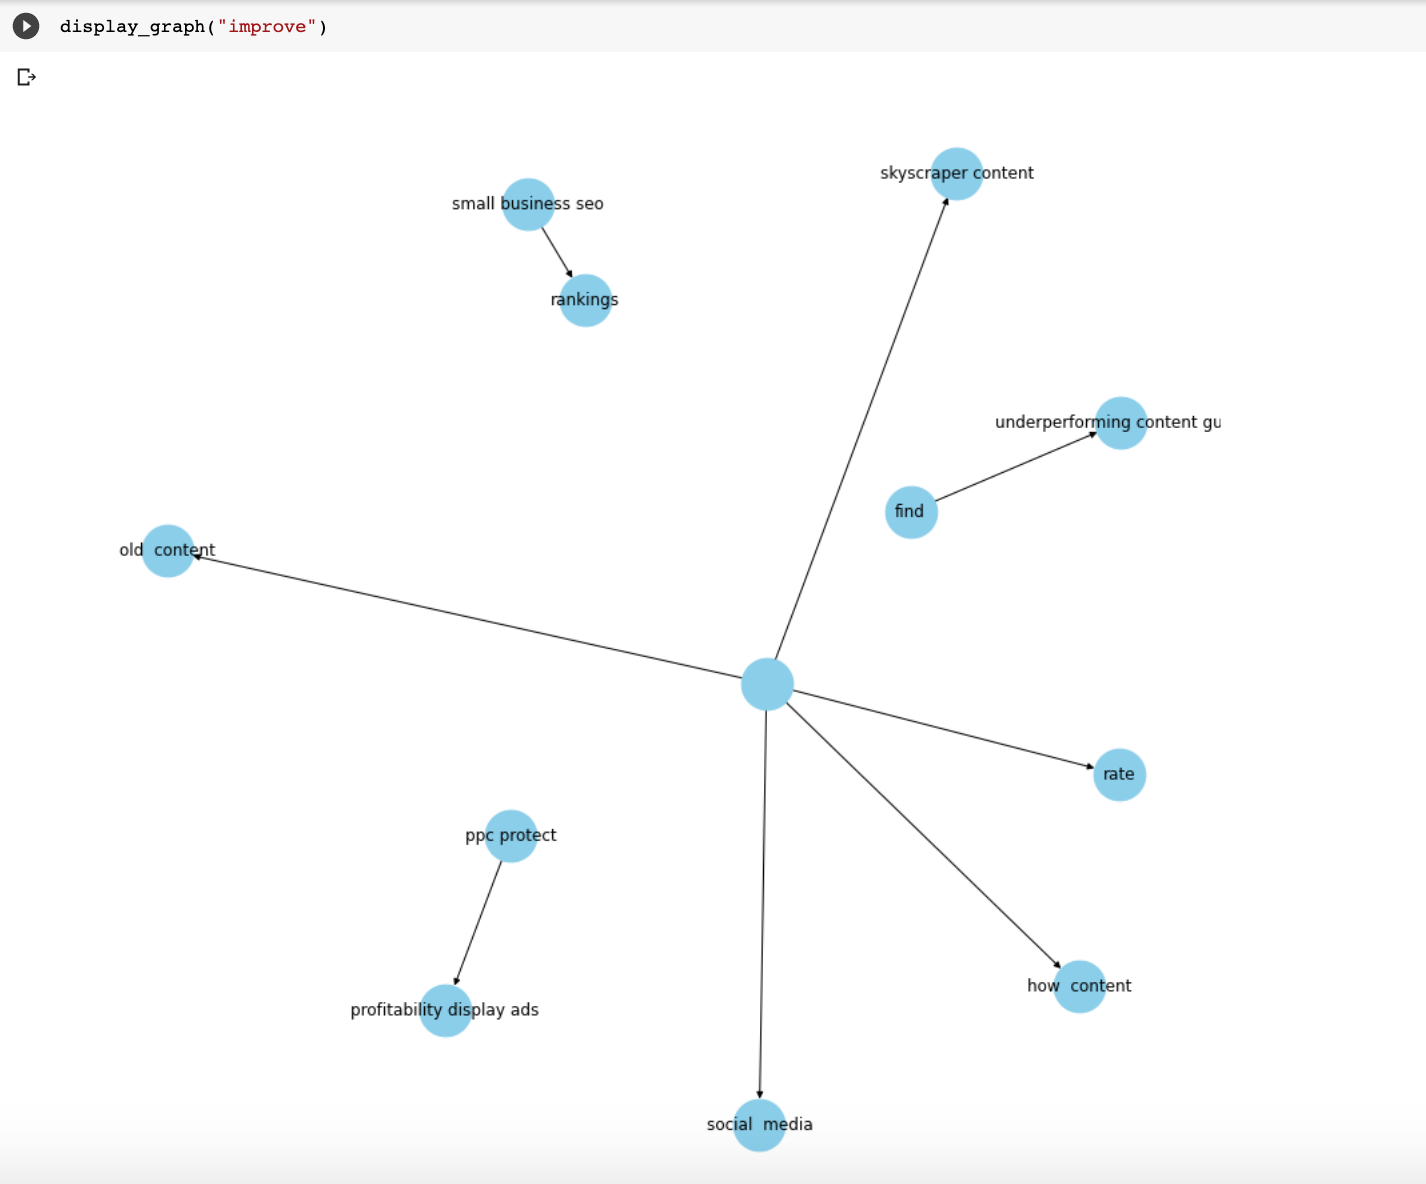
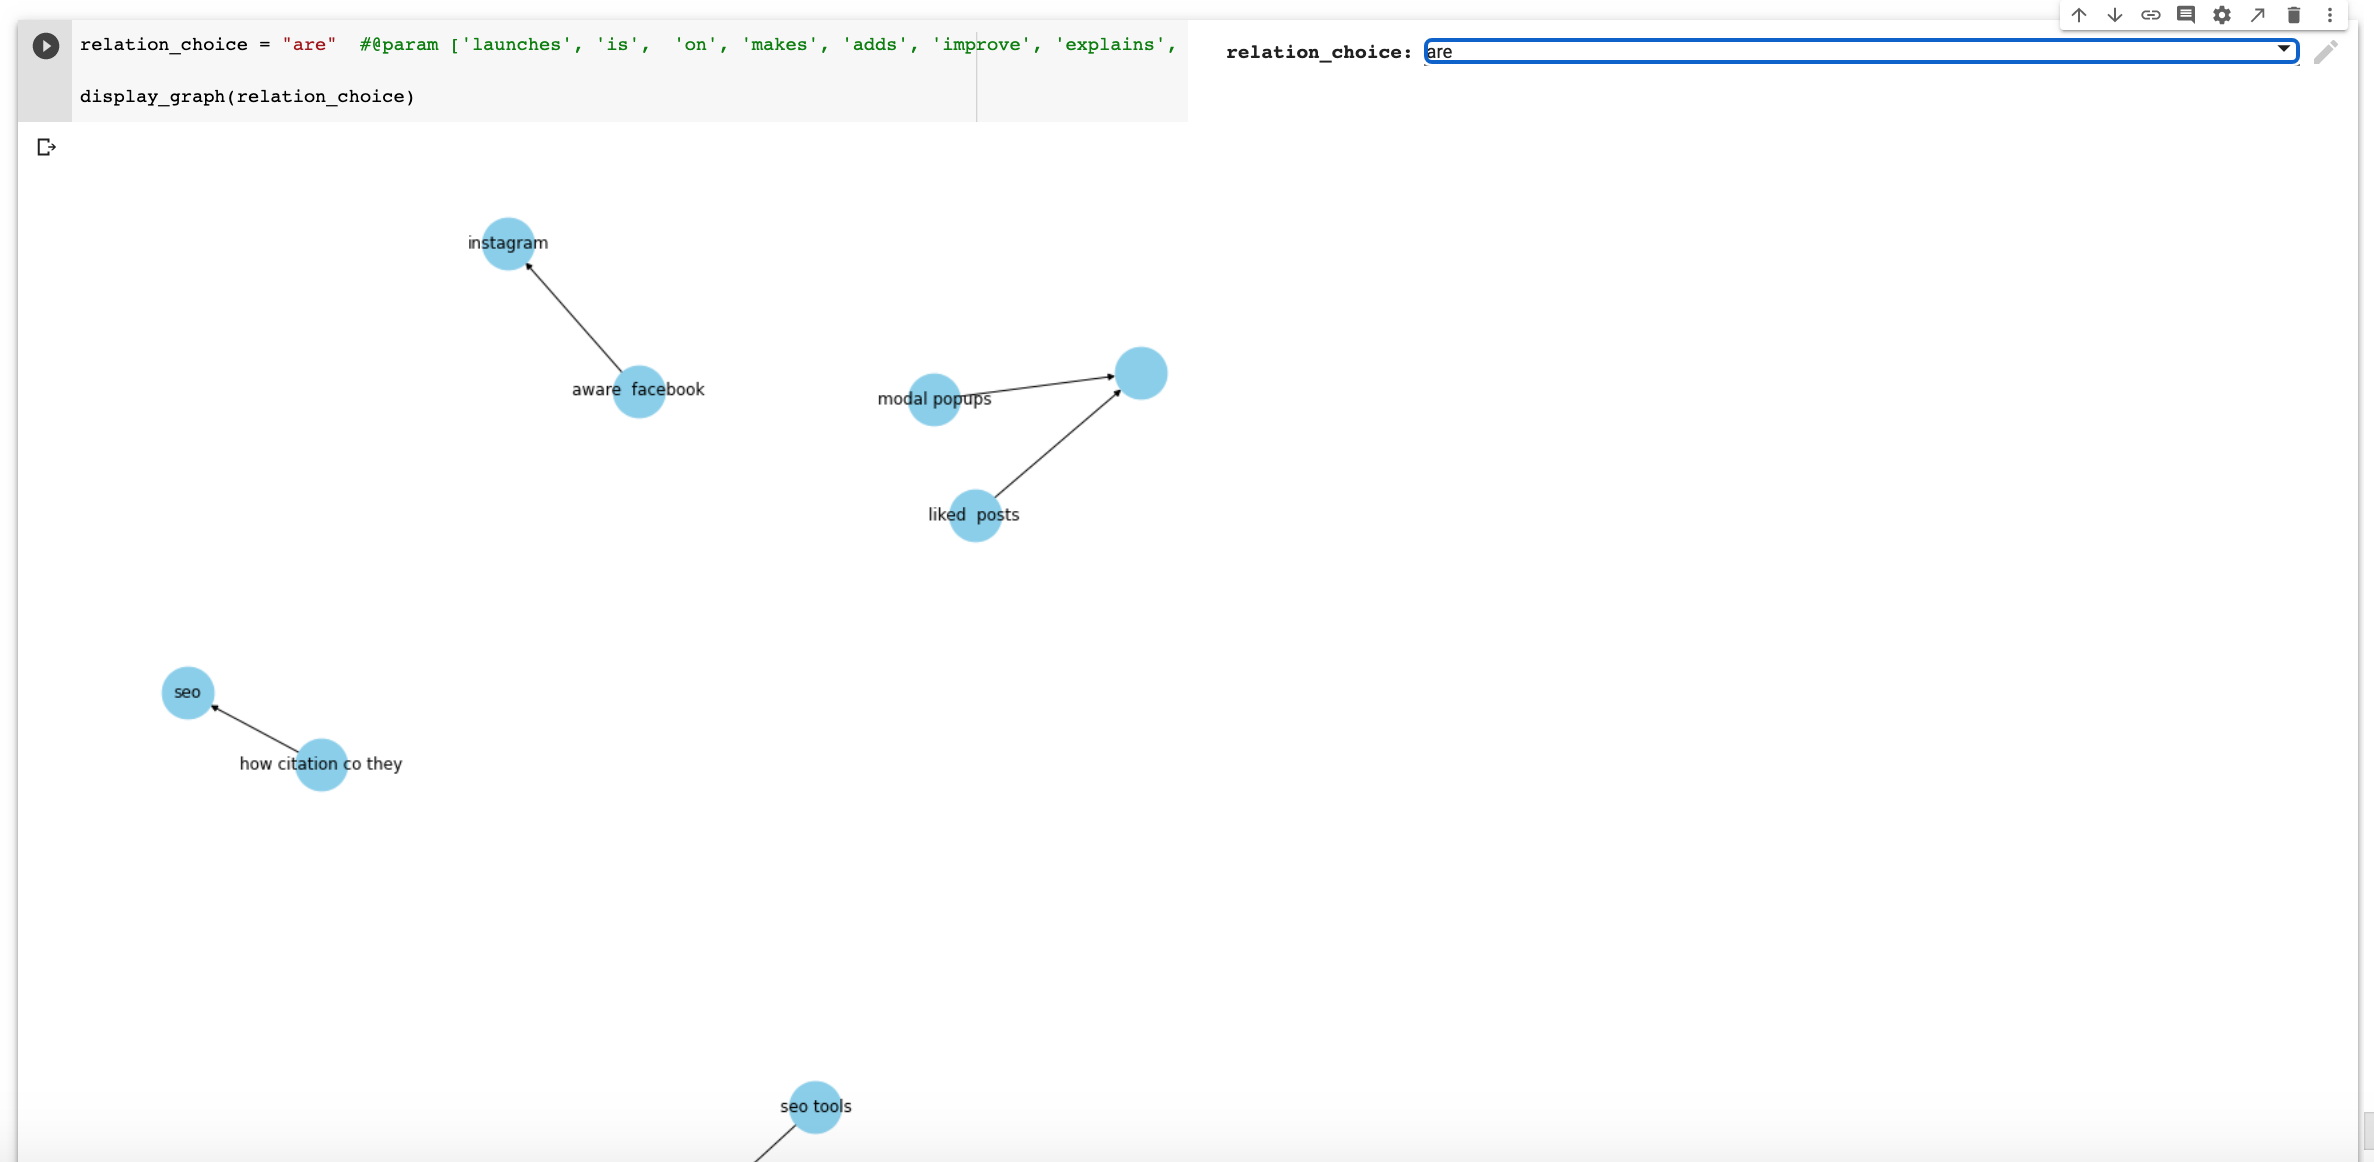
I created a Colab notebook with all the steps in this article and at the end, you will find a nice form with many more relationships to check out.
Just run all the code, click on the pulldown selector and click on the play button to see the graph.
Resources to Learn More & Community Projects
Here are some resources that I found useful while putting this tutorial together.
- Knowledge Graph – A Powerful Data Science Technique to Mine Information from Text (with Python code) (Analytics Vidhya)
- How Search Engines like Google Retrieve Results: Introduction to Information Extraction using Python and spaCy (Analytics Vidhya)
- spaCy : Text Meta Features, Knowledge Graphs (Kaggle)
- spaCy 101: Everything you need to know (spaCy)
- Examples (spaCy)
- Annotation Specifications (spaCy)
- Online marketing productivity and analysis tools (advertools)
I asked my follower to share the Python projects and excited to see how many creative ideas coming to life from the community! 🐍🔥
Here's a simple python script made with pandas and a semrush report to automate categorization of search intention (can be used in keyword studies): https://t.co/lDje8cw16Z
— Caroline Scholles (@carolscholles) August 12, 2020
What's "lately"? Used Python and Selenium to analyze Interesting Finds in mobile SERPs back in March (link to GitHub in the article) https://t.co/Eg5KxoqBi4
— Danielle (@d4ni_s) August 11, 2020
Automating screamingfrog and lighthouse to run weekly on our clients and storing data in mysql. Also calculating word frequencies across all client pages, per page and aggregate. Blending data from GSC, GA, SF and ahrefs.
— Greg Bernhardt (@GregBernhardt4) August 12, 2020
Bridging the gap between PPC data and organic data so that we can start to assign conversion values to organic keywords. It's using NLP and gingerit.
— Andy Chadwick (@digitalquokka) August 12, 2020
👉 Devising machine generated descriptive images alt text by Image tag/object detection (wip)
👉 Periodic analyzing top 3 google serp for list of imp keywords to track changes (&mapping with rank changes).
👉 Competition content tracking by parsing XML/wp-json.
1/2
— Venus Kalra (@venuskalra) August 12, 2020
👉 Posting 5XX from log files to slack to solve before GSC figures out.
👉 Keyword intent to url mapping
2/2
— Venus Kalra (@venuskalra) August 12, 2020
cohort analysis to predict future customers and leads counts ?
— Umar Igan (@Umar26338572) August 12, 2020
Hey Hamlet!
I'm still tweaking my entity analyzer, which now leverages both @googlecloud AND @spacy_io! 🐍🔥
I'm also chuffed that the app now retains session state via a cheeky @streamlit hack! 😏
I'll share as soon as ready. 🙌https://t.co/CTSLk1IYS6 pic.twitter.com/N59MfzLsy9
— Charly Wargnier ✊🏾 (@DataChaz) August 11, 2020
no llego al nivel de @DataChaz pero estoy intentando hacer categorización de palabras para keywordsresearch en bulk con clusterización y regresión lineal, así hay dos maneras de ver como poder hacer estas categorizaciones y elegir la que más te gusta
— JaviLázaro (@JaviLazaroSEO) August 11, 2020
More Resources:
- How Natural Language Generation Changes the SEO Game
- How to Generate Data-Driven Copy for Ecommerce Category Pages with GPT-2
- Doing More with Less: Automated, High-Quality Content Generation
Image Credits
All screenshots taken by author, August 2020



![AI Overviews: We Reverse-Engineered Them So You Don't Have To [+ What You Need To Do Next]](https://www.searchenginejournal.com/wp-content/uploads/2025/04/sidebar1x-455.png)