Google has announced a new trend change detection feature in Google Analytics.
This new capability will allow you to more easily identify subtle but meaningful shifts in data trends over time.
We’ve just introduced trend change detection, a new type of insight that surfaces subtle but long-lasting and important changes in your data. It works like anomaly detection since they both detect a change in data. The main difference is that anomaly detection highlights sudden… pic.twitter.com/RYqzikf8r1
— Google Analytics (@googleanalytics) February 13, 2024
What Is Trend Change Detection?
Trend change detection is designed to detect gradual, long-term changes in metrics rather than sudden spikes or dips.
While Google Analytics already has anomaly detection to highlight abnormal spikes or drops, this new feature focuses on more subtle changes in data trends spanning weeks or months.
How It Works
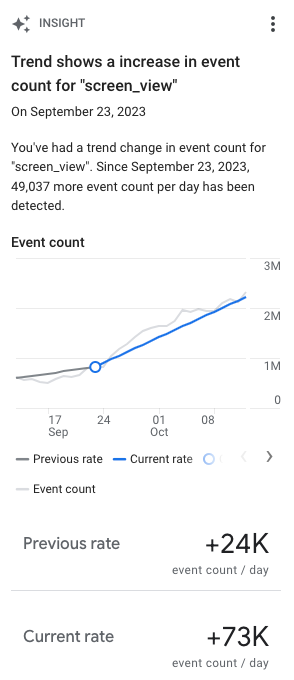
When Google Analytics detects a change in the direction of time-series data for a metric, it overlaps a marker in charts and graphs on the date the change occurred.
You can hover over the marker to see details about the change, including the previous and current rates of change and the exact date the trend shifted.
 Screenshot from: support.google.com, February 2024.
Clicking “Investigate Report” will open a more detailed view to analyze the data further. You can adjust the date range, compare other dimensions, and add breakdowns to better understand what is driving the trend change.
Why Trend Change Detection Matters
Unexpected downward trends require investigation to determine the cause. For example, a website code update could inadvertently break a registration button, leading to stalled user growth.
Without trend change detection, it could take weeks or months to notice the gradual decline in new registrations.
Google Analytics uses a signal segmentation algorithm to detect trend changes in time series data. For daily data, it examines approximately 90 days of history. For weekly data, the algorithm looks at around 32 weeks to identify potential trend changes.
Where You’ll See Trend Change Detection
Trend changes will be displayed in the following places in the Google Analytics interface:
- Insight cards on the main Home page
- The Reports snapshot page
- The Advertising snapshot page
- The dedicated Insights hub
Types of Trend Changes Detected
The new detection capability is designed to surface the following types of trend changes:
- Increase to decrease (growth slowing)
- Decrease to increase (decline reversing)
- Larger increase or decrease (growth or decline accelerating)
- Smaller increase or decrease (growth slowing or decline easing)
Tips For Using Trend Change Detection
Leveraging Google’s new granular trend tracking provides an edge in diagnosing opportunities and threats in organic data patterns.
Monitoring organic traffic metrics week-over-week and month-over-month allows you to detect unexpected downward trends that could indicate issues like:
- Sites being penalized or blocked
- New algorithm updates decreasing rankings
- Technical SEO issues preventing crawling and indexing
Early detection of these trend changes allows you to investigate and address the root causes quickly.
FAQ
How does trend change detection differ from anomaly detection in Google Analytics?
Trend change detection and anomaly detection are two distinct features within Google Analytics that cater to different analytical requirements:
- Trend change detection is engineered to identify prolonged, gradual shifts in metrics over time rather than immediate, stark fluctuations.
- Anomaly detection highlights irregular spikes or drops that deviate from the standard data patterns.
- Together, they provide a comprehensive overview of both short-term anomalies and long-term trends within the data.
How can marketers effectively utilize Google Analytics’ trend change detection?
Marketers can leverage trend change detection to maintain oversight of website performance in the following ways:
- Regularly monitor insight cards and reports within Google Analytics to detect and investigate any marked changes in data trends.
- Use the “Investigate Report” feature to delve deeper into the data and understand the dynamics driving these changes.
- Quickly address issues flagged by downward trends that may indicate technical SEO problems, penalties, or adverse effects from algorithm updates.
Featured Image: Vladimka production/Shutterstock


![[SEO, PPC & Attribution] Unlocking The Power Of Offline Marketing In A Digital World](https://www.searchenginejournal.com/wp-content/uploads/2025/03/sidebar1x-534.png)