This post was sponsored by DebugBear. The opinions expressed in this article are the sponsor’s own.
Keeping your website fast is important for user experience and SEO.
The Core Web Vitals initiative by Google provides a set of metrics to help you understand the performance of your website.
The three Core Web Vitals metrics are:
This post focuses on the recently introduced INP metric and what you can do to improve it.
In This Guide
How Is Interaction To Next Paint Measured?
INP measures how quickly your website responds to user interactions – for example, a click on a button. More specifically, INP measures the time in milliseconds between the user input and when the browser has finished processing the interaction and is ready to display any visual updates on the page.
Your website needs to complete this process in under 200 milliseconds to get a “Good” score. Values over half a second are considered “Poor”. A poor score in a Core Web Vitals metric can negatively impact your search engine rankings.
Google collects INP data from real visitors on your website as part of the Chrome User Experience Report (CrUX). This CrUX data is what ultimately impacts rankings.
-
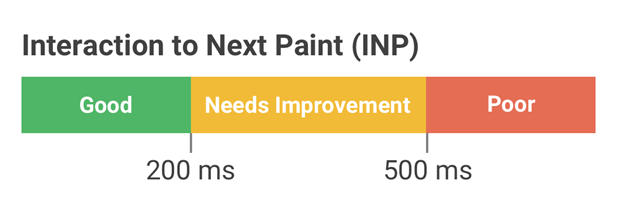 Image created by DebugBear, May 2024
How To Identify & Fix Slow INP Times
The factors causing poor Interaction to Next Paint can often be complex and hard to figure out. Follow this step-by-step guide to understand slow interactions on your website and find potential optimizations.
1. How To Identify A Page With Slow INP Times
Different pages on your website will have different Core Web Vitals scores. So you need to identify a slow page and then investigate what’s causing it to be slow.
Using Google Search Console
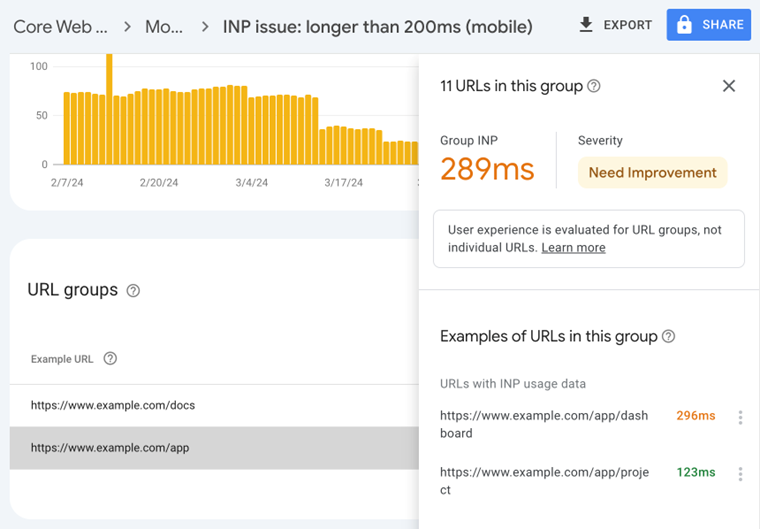
One easy way to check your INP scores is using the Core Web Vitals section in Google Search Console, which reports data based on the Google CrUX data we’ve discussed before.
By default, page URLs are grouped into URL groups that cover many different pages. Be careful here – not all pages might have the problem that Google is reporting. Instead, click on each URL group to see if URL-specific data is available for some pages and then focus on those.
-
 Screenshot of Google Search Console, May 2024
Using A Real-User Monitoring (RUM) Service
Google won’t report Core Web Vitals data for every page on your website, and it only provides the raw measurements without any details to help you understand and fix the issues. To get that you can use a real-user monitoring tool like DebugBear.
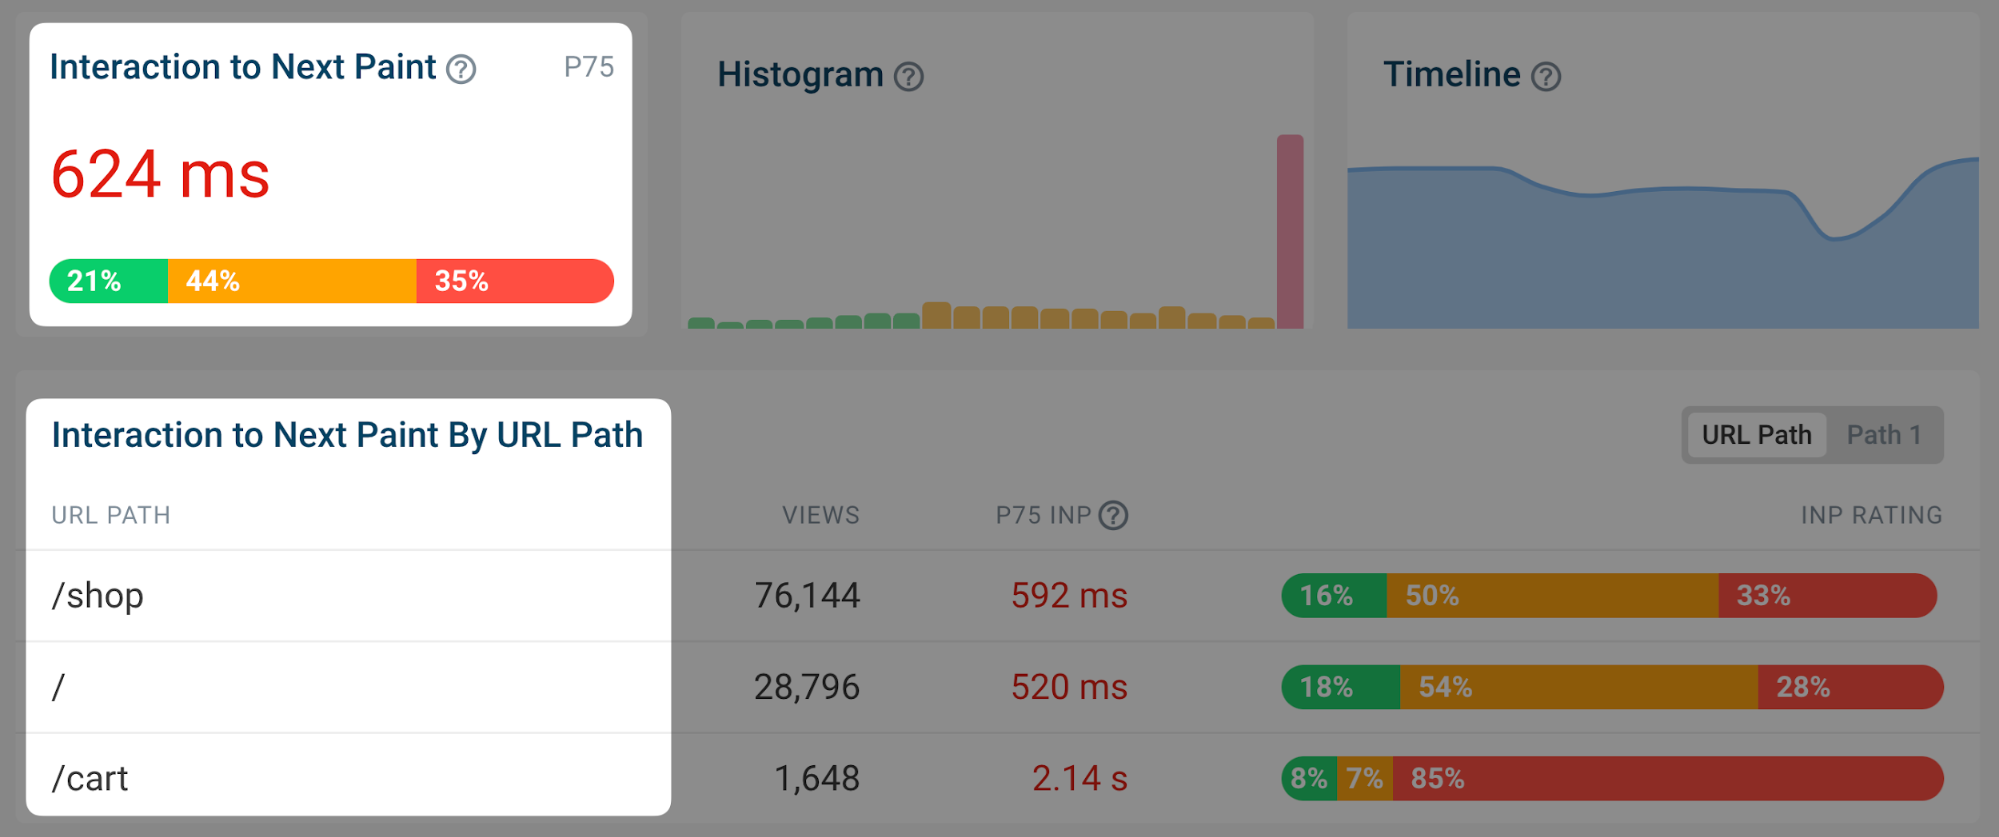
Real-user monitoring works by installing an analytics snippet on your website that measures how fast your website is for your visitors. Once that’s set up you’ll have access to an Interaction to Next Paint dashboard like this:
-
 Screenshot of the DebugBear Interaction to Next Paint dashboard, May 2024
You can identify pages you want to optimize in the list, hover over the URL, and click the funnel icon to look at data for that specific page only.
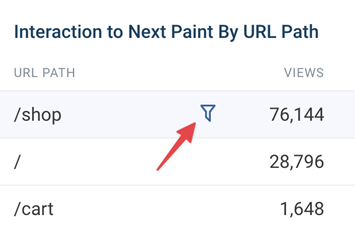 Image created by DebugBear, May 2024
2. Figure Out What Element Interactions Are Slow
Different visitors on the same page will have different experiences. A lot of that depends on how they interact with the page: if they click on a background image there’s no risk of the page suddenly freezing, but if they click on a button that starts some heavy processing then that’s more likely. And users in that second scenario will experience much higher INP.
To help with that, RUM data provides a breakdown of what page elements users interacted with and how big the interaction delays were.
-
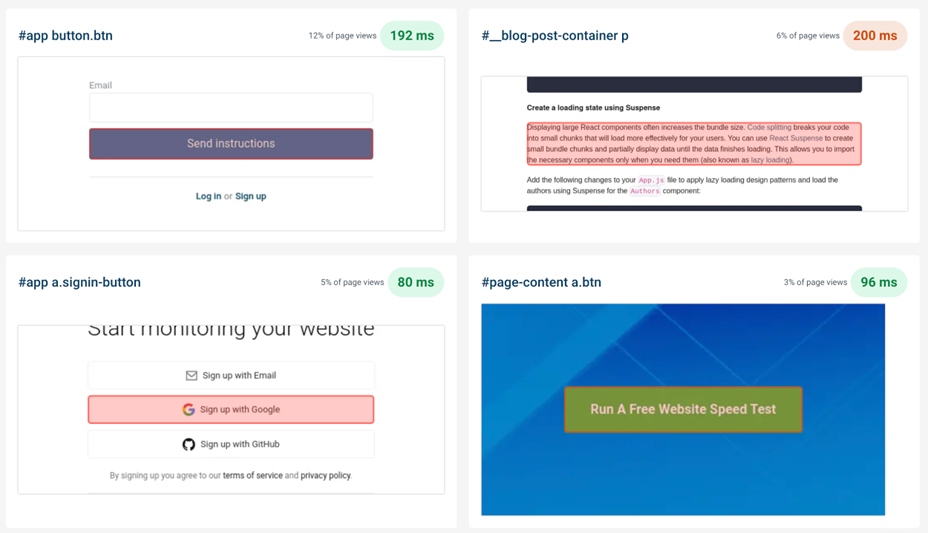 Screenshot of the DebugBear INP Elements view, May 2024
The screenshot above shows different INP interactions sorted by how frequent these user interactions are. To make optimizations as easy as possible you’ll want to focus on a slow interaction that affects many users.
In DebugBear, you can click on the page element to add it to your filters and continue your investigation.
3. Identify What INP Component Contributes The Most To Slow Interactions
INP delays can be broken down into three different components:
- Input Delay: Background code that blocks the interaction from being processed.
- Processing Time: The time spent directly handling the interaction.
- Presentation Delay: Displaying the visual updates to the screen.
You should focus on which INP component is the biggest contributor to the slow INP time, and ensure you keep that in mind during your investigation.
-
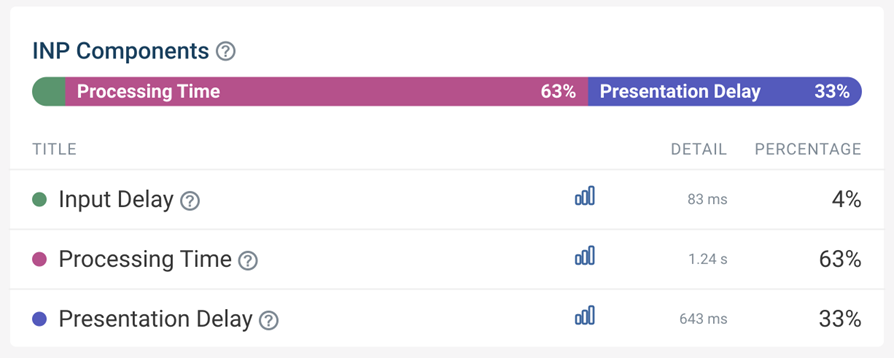 Screenshot of the DebugBear INP Components, May 2024
In this scenario, Processing Time is the biggest contributor to the slow INP time for the set of pages you’re looking at, but you need to dig deeper to understand why.
High processing time indicates that there is code intercepting the user interaction and running slow performing code. If instead you saw a high input delay, that suggests that there are background tasks blocking the interaction from being processed, for example due to third-party scripts.
4. Check Which Scripts Are Contributing To Slow INP
Sometimes browsers report specific scripts that are contributing to a slow interaction. Your website likely contains both first-party and third-party scripts, both of which can contribute to slow INP times.
A RUM tool like DebugBear can collect and surface this data. The main thing you want to look at is whether you mostly see your own website code or code from third parties.
-
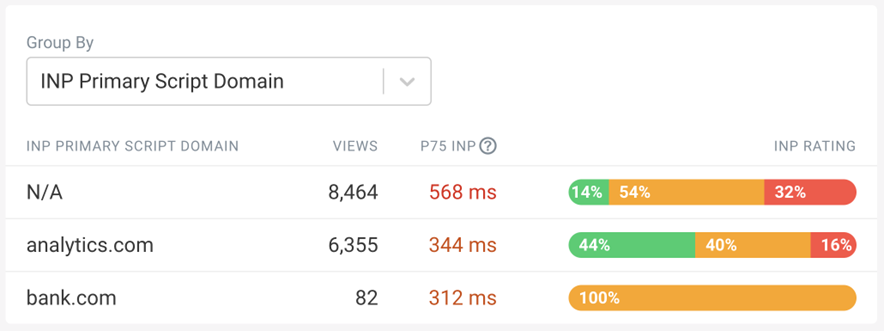 Screenshot of the INP Primary Script Domain Grouping in DebugBear, May 2024
Tip: When you see a script, or source code function marked as “N/A”, this can indicate that the script comes from a different origin and has additional security restrictions that prevent RUM tools from capturing more detailed information.
This now begins to tell a story: it appears that analytics/third-party scripts are the biggest contributors to the slow INP times.
5. Identify Why Those Scripts Are Running
At this point, you now have a strong suspicion that most of the INP delay, at least on the pages and elements you’re looking at, is due to third-party scripts. But how can you tell whether those are general tracking scripts or if they actually have a role in handling the interaction?
DebugBear offers a breakdown that helps see why the code is running, called the INP Primary Script Invoker breakdown. That’s a bit of a mouthful – multiple different scripts can be involved in slowing down an interaction, and here you just see the biggest contributor. The “Invoker” is just a value that the browser reports about what caused this code to run.
-
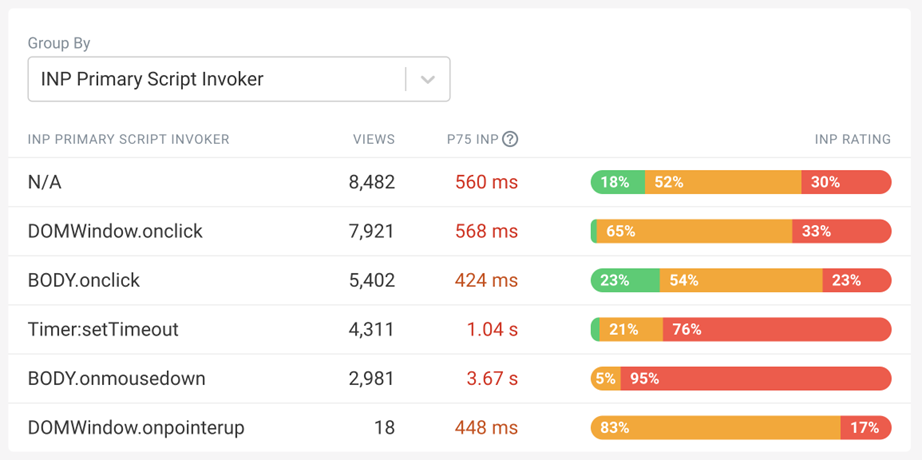 Screenshot of the INP Primary Script Invoker Grouping in DebugBear, May 2024
The following invoker names are examples of page-wide event handlers:
- onclick
- onmousedown
- onpointerup
You can see those a lot in the screenshot above, which tells you that the analytics script is tracking clicks anywhere on the page.
In contrast, if you saw invoker names like these that would indicate event handlers for a specific element on the page:
- .load_more.onclick
- #logo.onclick
6. Review Specific Page Views
A lot of the data you’ve seen so far is aggregated. It’s now time to look at the individual INP events, to form a definitive conclusion about what’s causing slow INP in this example.
Real user monitoring tools like DebugBear generally offer a way to review specific user experiences. For example, you can see what browser they used, how big their screen is, and what element led to the slowest interaction.
-
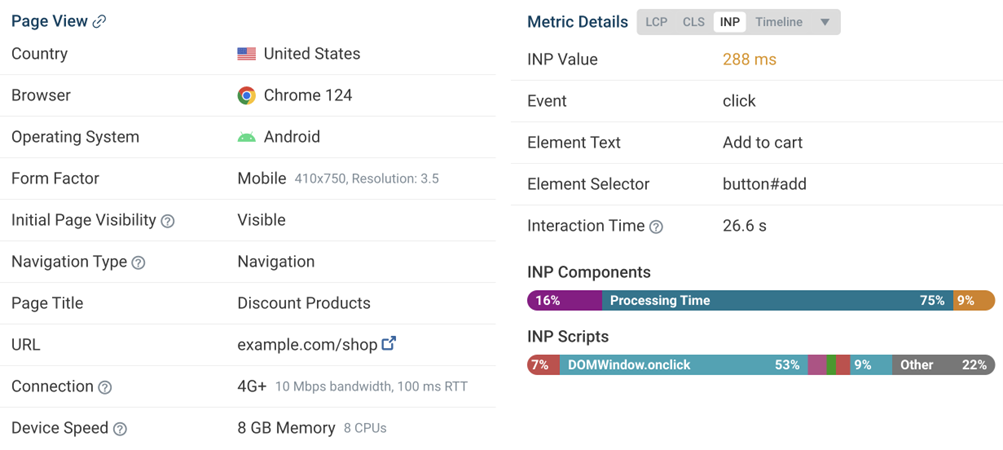 Screenshot of a Page View in DebugBear Real User Monitoring, May 2024
As mentioned before, multiple scripts can contribute to overall slow INP. The INP Scripts section shows you the scripts that were run during the INP interaction:
-
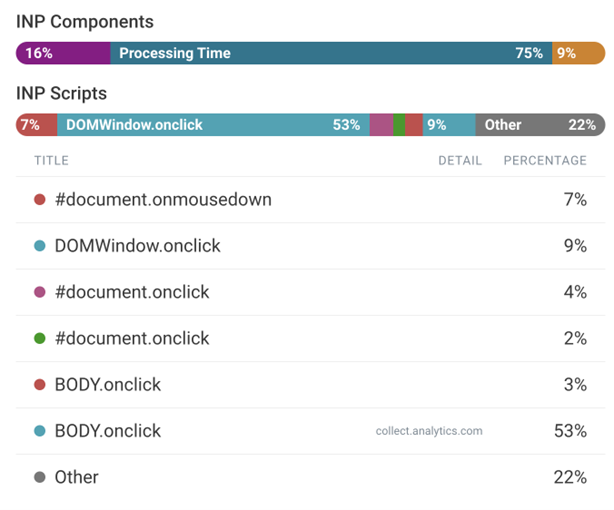 Screenshot of the DebugBear INP script breakdown, May 2024
You can review each of these scripts in more detail to understand why they run and what’s causing them to take longer to finish.
7. Use The DevTools Profiler For More Information
Real user monitoring tools have access to a lot of data, but for performance and security reasons they can access nowhere near all the available data. That’s why it’s a good idea to also use Chrome DevTools to measure your page performance.
To debug INP in DevTools you can measure how the browser processes one of the slow interactions you’ve identified before. DevTools then shows you exactly how the browser is spending its time handling the interaction.
-
 Screenshot of a performance profile in Chrome DevTools, May 2024
How You Might Resolve This Issue
In this example, you or your development team could resolve this issue by:
- Working with the third-party script provider to optimize their script.
- Removing the script if it is not essential to the website, or finding an alternative provider.
- Adjusting how your own code interacts with the script
How To Investigate High Input Delay
In the previous example most of the INP time was spent running code in response to the interaction. But often the browser is already busy running other code when a user interaction happens. When investigating the INP components you’ll then see a high input delay value.
This can happen for various reasons, for example:
- The user interacted with the website while it was still loading.
- A scheduled task is running on the page, for example an ongoing animation.
- The page is loading and rendering new content.
To understand what’s happening, you can review the invoker name and the INP scripts section of individual user experiences.
-
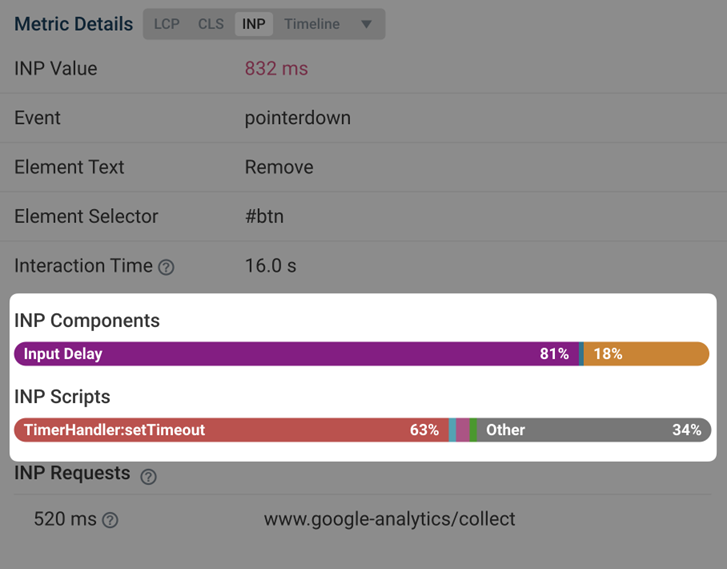 Screenshot of the INP Component breakdown within DebugBear, May 2024
In this screenshot, you can see that a timer is running code that coincides with the start of a user interaction.
The script can be opened to reveal the exact code that is run:
-
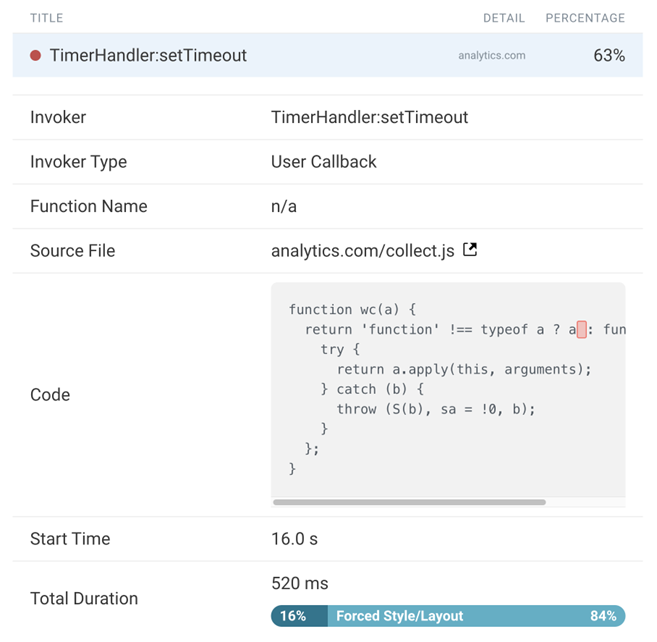 Screenshot of INP script details in DebugBear, May 2024
The source code shown in the previous screenshot comes from a third-party user tracking script that is running on the page.
At this stage, you and your development team can continue with the INP workflow presented earlier in this article. For example, debugging with browser DevTools or contacting the third-party provider for support.
How To Investigate High Presentation Delay
Presentation delay tends to be more difficult to debug than input delay or processing time. Often it’s caused by browser behavior rather than a specific script. But as before, you still start by identifying a specific page and a specific interaction.
You can see an example interaction with high presentation delay here:
-
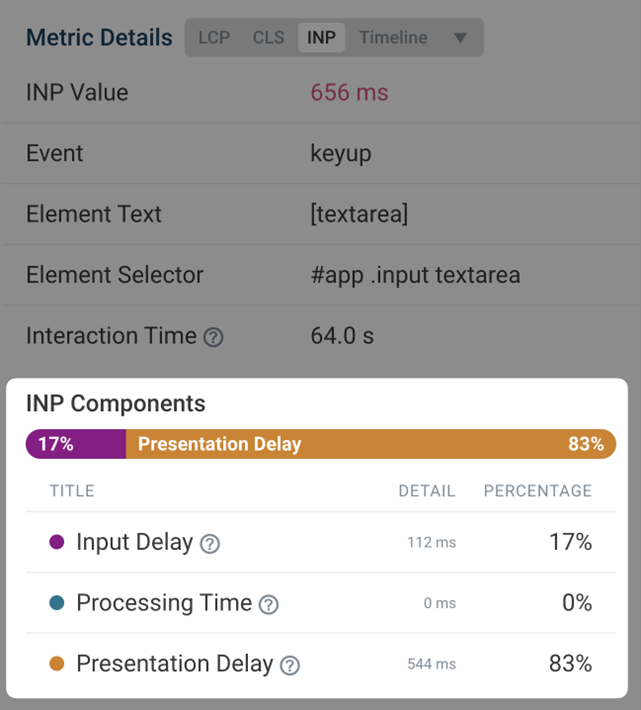 Screenshot of the an interaction with high presentation delay, May 2024
You see that this happens when the user enters text into a form field. In this example, many visitors pasted large amounts of text that the browser had to process.
Here the fix was to delay the processing, show a “Waiting…” message to the user, and then complete the processing later on. You can see how the INP score improves from May 3:
-
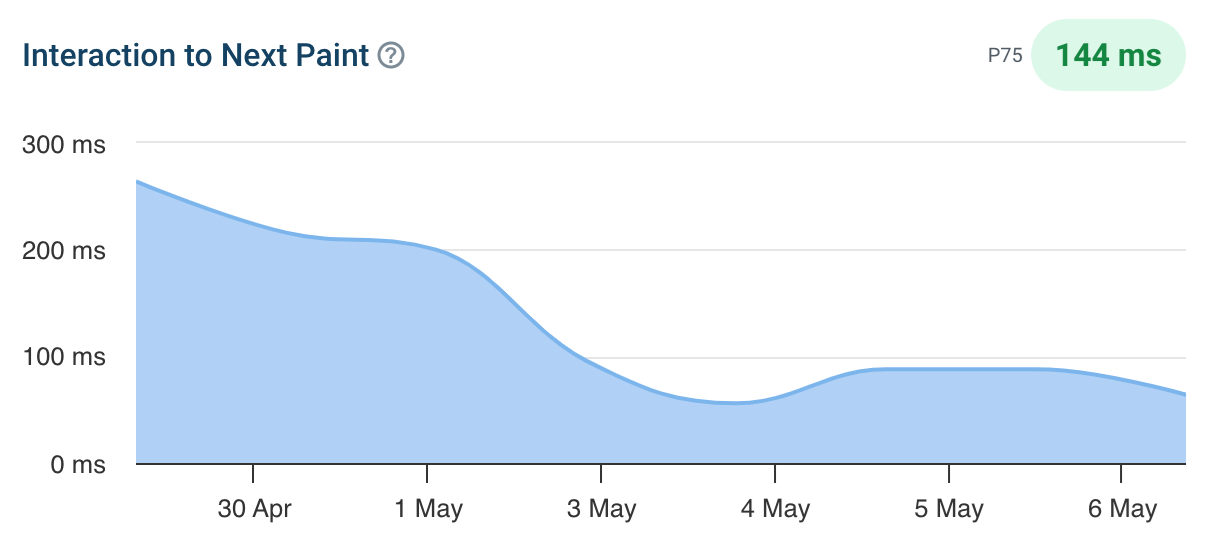 Screenshot of an Interaction to Next Paint timeline in DebugBear, May 2024
Get The Data You Need To Improve Interaction To Next Paint
Setting up real user monitoring helps you understand how users experience your website and what you can do to improve it. Try DebugBear now by signing up for a free 14-day trial.
-
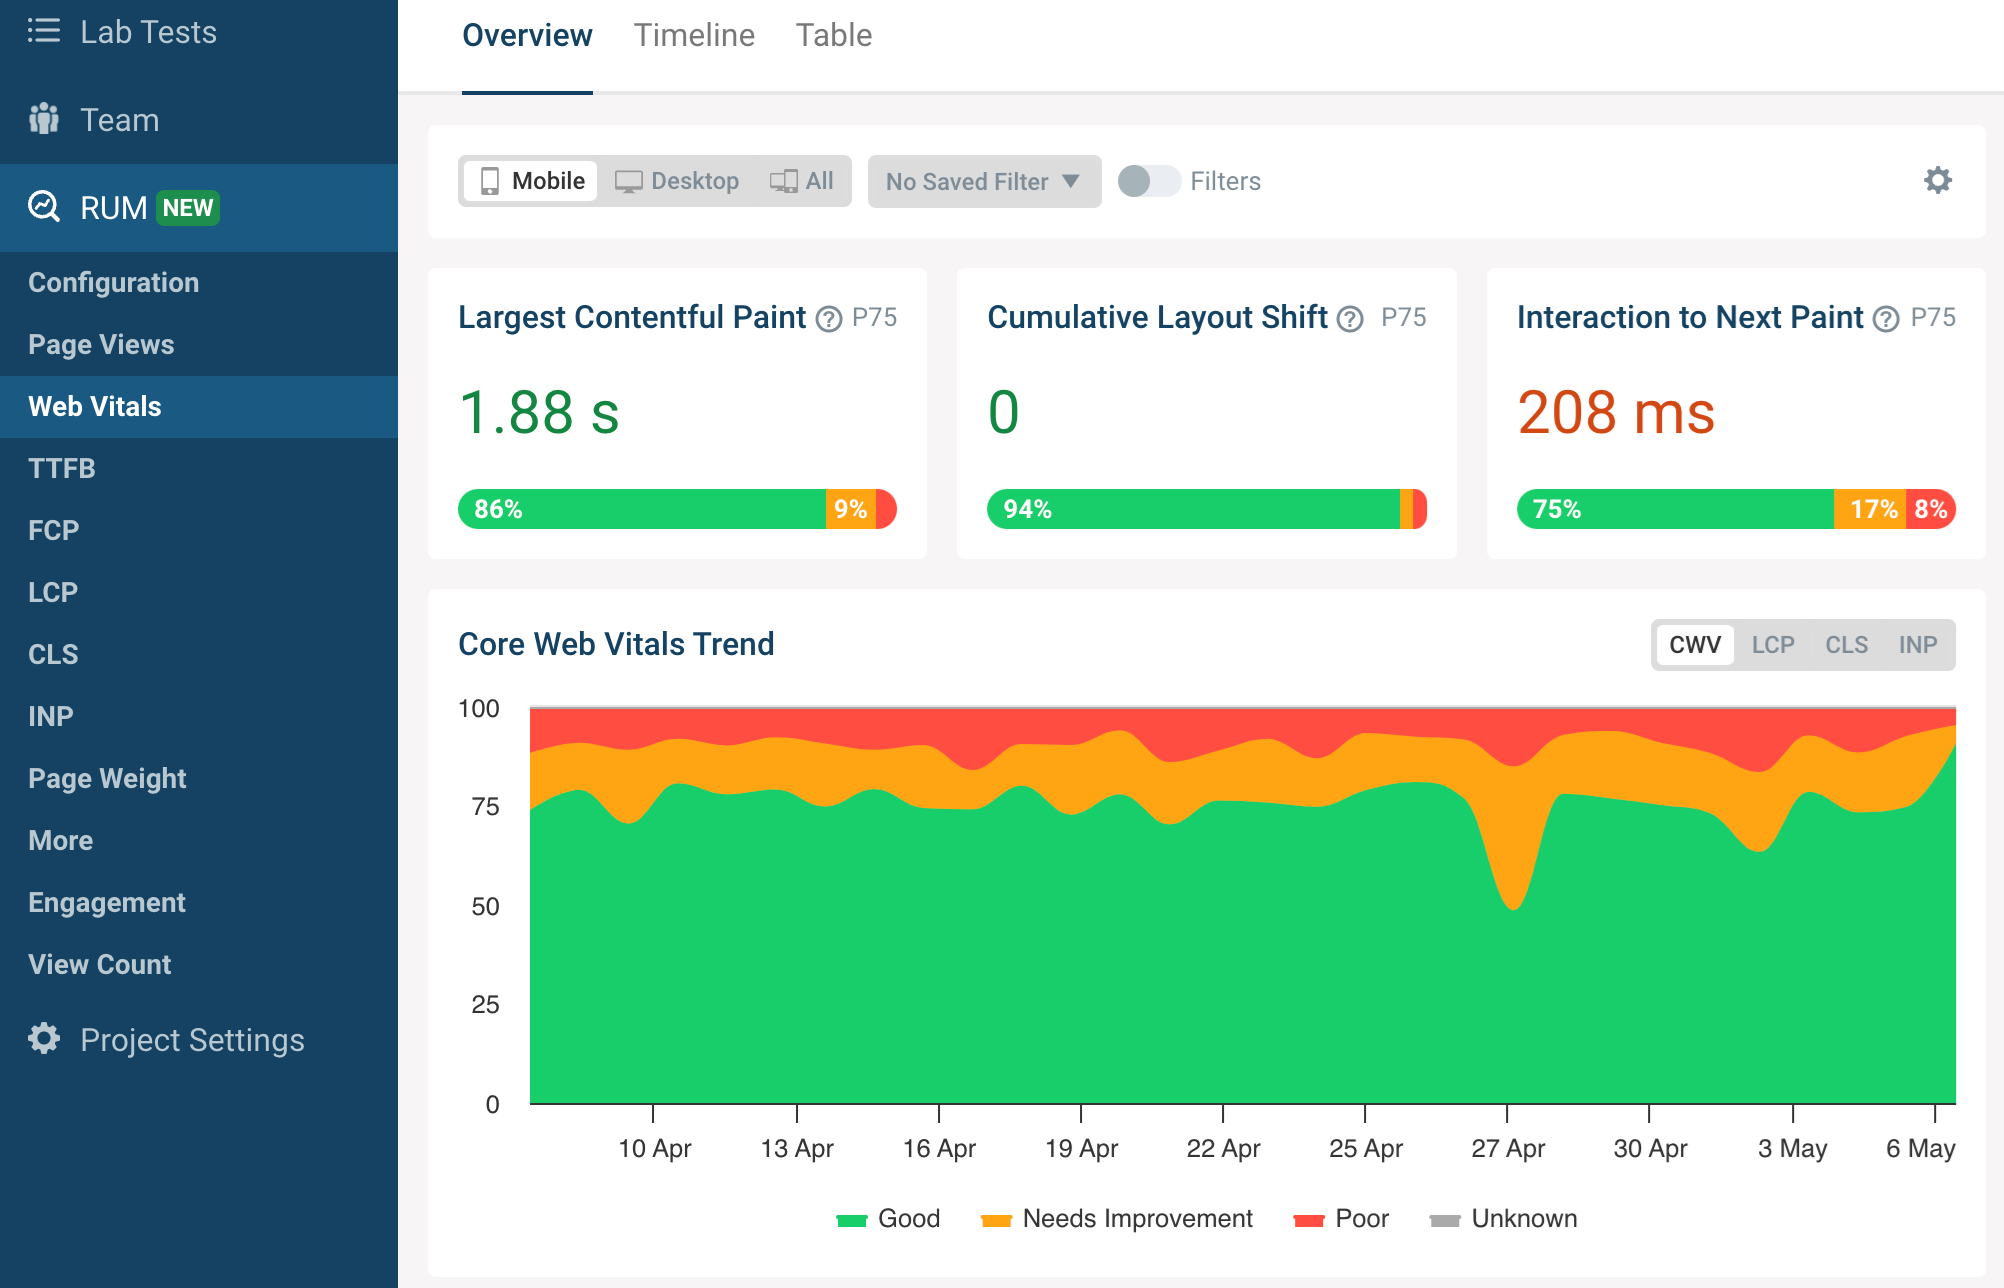 Screenshot of the DebugBear Core Web Vitals dashboard, May 2024
Google’s CrUX data is aggregated over a 28-day period, which means that it’ll take a while before you notice a regression. With real-user monitoring you can see the impact of website changes right away and get alerted automatically when there’s a big change.
DebugBear monitors lab data, CrUX data, and real user data. That way you have all the data you need to optimize your Core Web Vitals in one place.
This article has been sponsored by DebugBear, and the views presented herein represent the sponsor’s perspective.
Ready to start optimizing your website? Sign up for DebugBear and get the data you need to deliver great user experiences.
Image Credits
Featured Image: Image by Redesign.co. Used with permission.


