Are slow page speeds hurting your Google search rankings? Conducting page speed audits will help you find out.
But where do you start?
Here are three tools you can use to do quick and thorough page speed audits to help your page speed optimization efforts.
Google Chrome’s Developer Tools
Let’s start with the simplest and most helpful tool: Google Chrome’s Developer Tools. The tool comes with Chrome, and you can access it by right clicking any page in Chrome, choosing inspect, and toggling to the network tab.
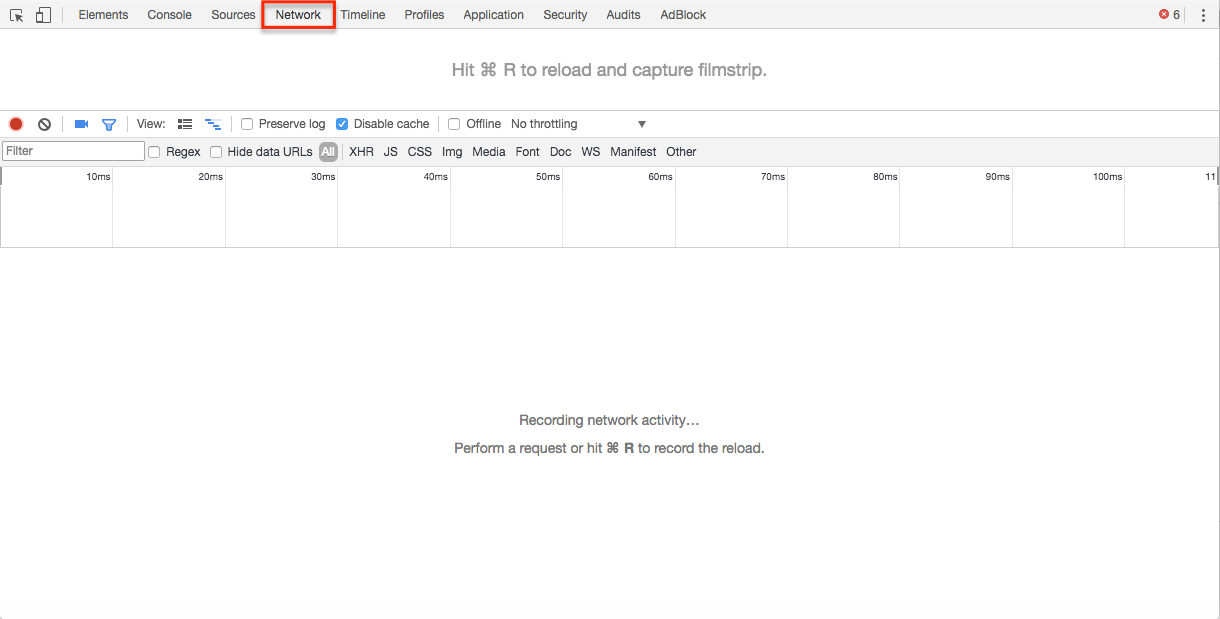 This is what the developer tools network panel looks like
The types of insights you can get from this tool are invaluable and can give you a good idea of where and what the problem areas are on your website.
Here are some tips for when you run your tests:
- Disable cache: This allows you to mimic the experience of a brand new visitor. Since new visitors will have to download all your assets in order to cache it, this gives you a view of where your site stands in terms of load speed.
- Enable capture screenshots: Click the camera icon. This will provide you with snapshots of the page’s load progressions. You can see how the new user experiences your site in increments until the page completes the full load.
- Toggle between different mobile device screens: A toggle device toolbar in the top left corner allows you to toggle between different devices. Chrome has a few preset device settings and allows you to edit to specific dimensions. You can see how your page loads on different screen resolutions and where you might be lacking in either the desktop or mobile experience.
- Toggle between different connection speeds: This throttling options allows you to test how your site performs on different types of internet connections. This is especially valuable when testing for mobile. You can see exactly how a new user experiences your site from a home wifi and 4G or 3G connections. Google mentioned that the average mobile landing page loads in 22 seconds, which seemed unbelievable at first, but turned out to be true when testing some websites on 3G connections.
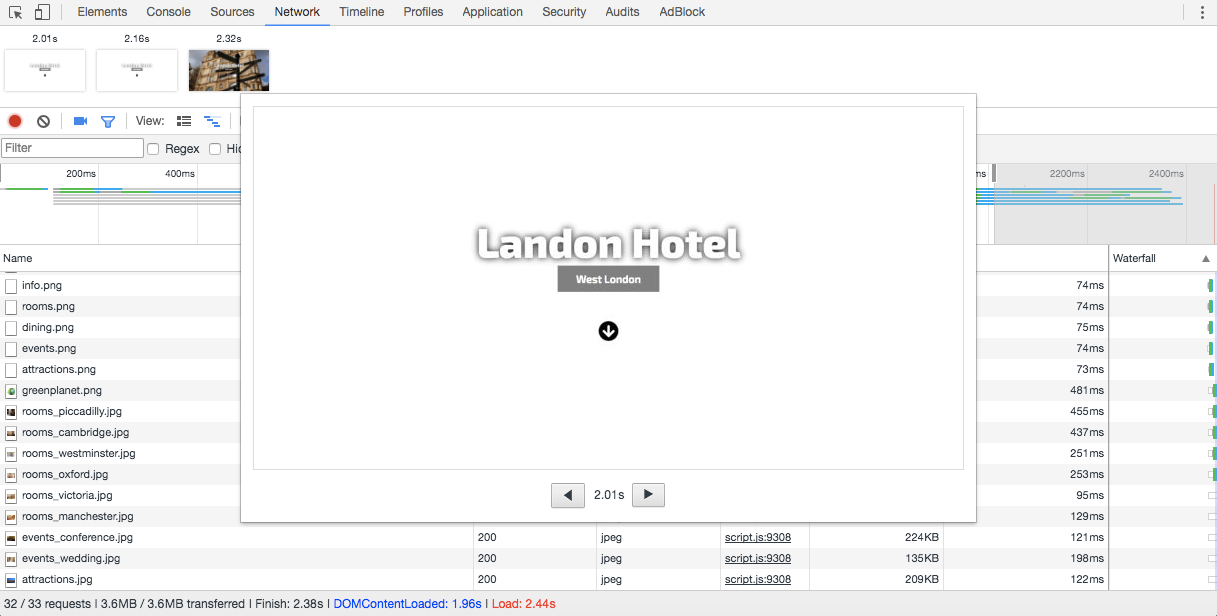 This screenshot shows the page load screenshot for at the 2 second interval.
In this desktop experience example, I have checked ‘Disable cache’ and selected ‘Capture screenshots’. I can begin a basic page load speed audit from this point, all in one convenient place.
Follow the instructions to reload the page with the inspector tool; if you’re using Windows, it’s F5, and if you are using Mac, it’s CMD-R.
What happens now is your web page will load, capture screenshots, and create a waterfall chart of how your page is loading each resource and in what order. Excellent!
There is a lot of info to process now and we will dive into common problems you will probably experience as you do more of these.
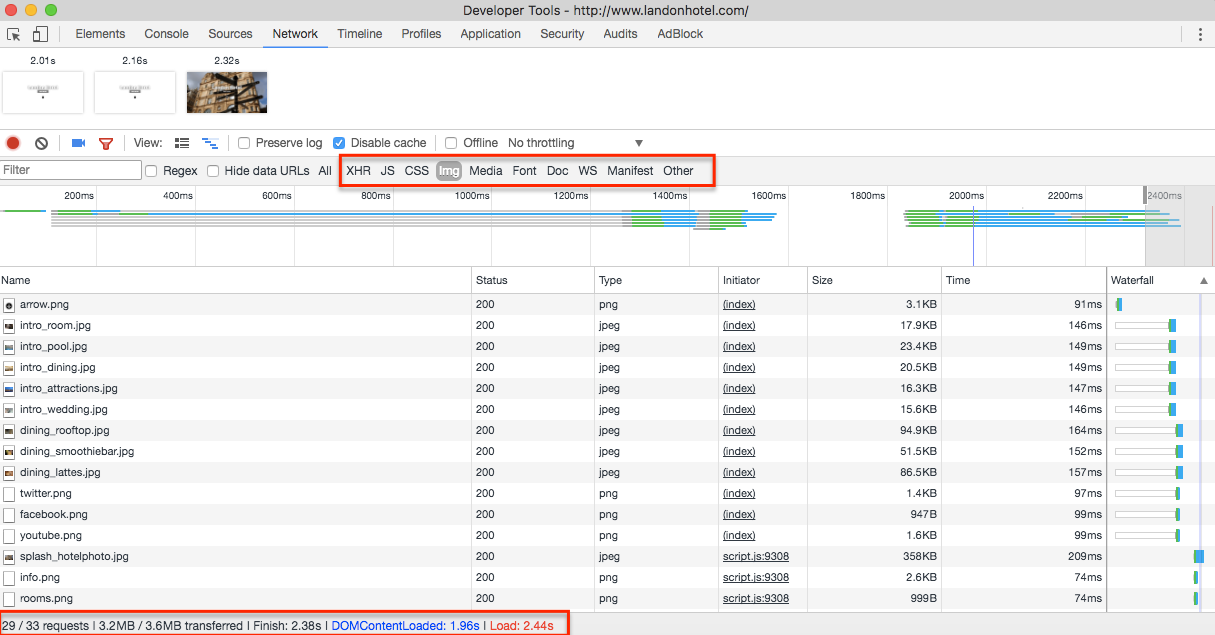 Toggle through different resources and see where bottlenecks are.
The footer will tell you a number of important information you should log:
- Server requests
- Bytes transferred
- Finish time
- DOMContentLoaded
- Load Time
For our example, I can see a screenshot of 2 seconds where the main hero image has not loaded yet. This is not an ideal experience. If you reference the waterfall chart, you can see where exactly the main hero image is on the priority list when the page loads.
The great thing about this tool is that it comes with a few more toggles. These toggles allow you to filter the resources loaded on the page. This is just an example, but for relatively larger sites that use a lot of imagery, they tend to be slowed down due to a lack of compressed images or just the quantity of images, in general, making up the majority of server requests on the page.
With Chrome Developer Tools, you can actually quantify how much space those specific elements are occupying and make a clear judgment on where to shave off the fat on your site.
For this site, I have toggled to images and can see that the images for this page makes up 29/33 server requests for this page and contributes to 3.2/3.6MB of its total page weight. So an obvious place to start here would be to compress the images or consider even removing some images if we want to improve page speed performance.
You can also toggle through the waterfall chart and see what loads first on your page. Ideally, don’t want any unnecessary JavaScript files placed before any of the intended visual elements of the page. This causes a delay in rendering the page’s main content; if possible you would want to move JavaScript files to the bottom, below all the body content, so as not to interfere with page rendering.
To get the full information about how to get the most out of this tool, check out Google’s document about Measuring Resource Loading and see how this tool can better help you get the insights you need.
Google’s Page Speed Test
We can use Google’s Page Speed Test as a good place to start figuring out the exact problems Google thinks is negatively affecting our page load times.
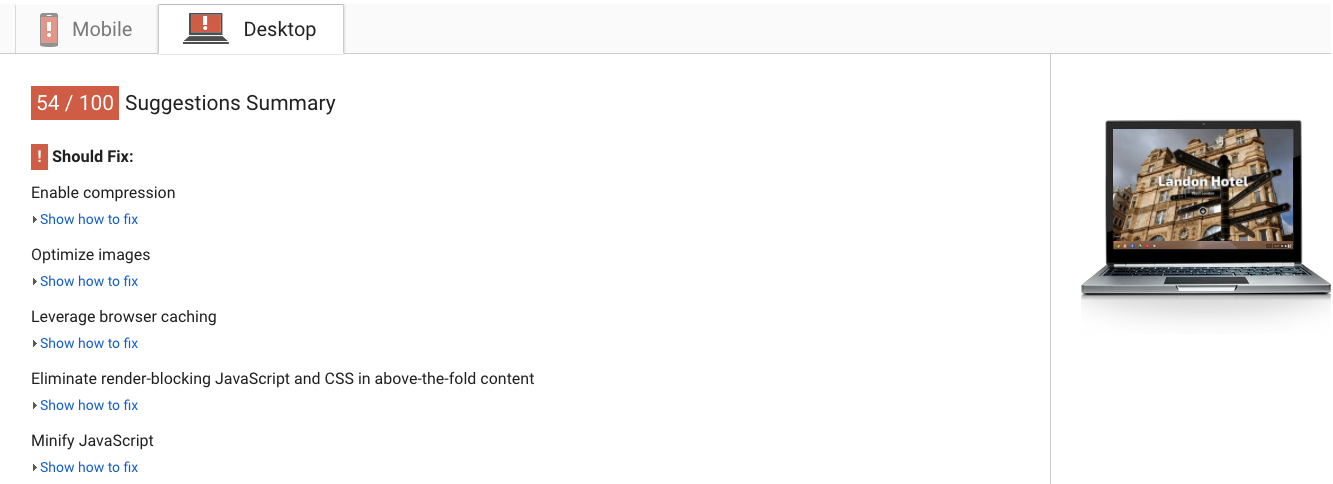 Google’s Page Speed Test gives you a broad idea on what needs to be done.
As you can see, there are a lot of areas for improvement identified by Google.
The score for this page is 54/100 — definitely not ideal. We see recommendations that include:
- Enable compression
- Optimize images
- Leverage browser caching
- Eliminate render-blocking JavaScript and CSS in above-the-fold content
- Minify JavaScript
You can dive deeper into every recommendation and learn more about how to optimize your website’s speed from Google’s developer documents.
GT Metrix for Actionable Steps
Another great tool for doing some quick page analysis is GT Metrix. GT Metrix grades your page based on Google’s Page Speed Tests and YSlow criteria, but the recommendations are more detailed and all in one place – helpful for a quick audit.
We already identified a lot of the issues with our web page using Google’s Page Speed Test. But Google doesn’t give you any actionable advice on how to fix those issues.
For example, Google will tell you how much space you can save if you compressed these images, but they won’t give you a compressed version of the image, they don’t tell you exactly how to optimize those images, or the exact dimensions you need to scale down to.
Thankfully, the GT Metrix reports are more detailed and actionable.
GT Metrix provides the following information that many other tools will not provide, including:
- JavaScript redirect chains
- Optimized images to download
- Exact Image Dimensions for Scaling
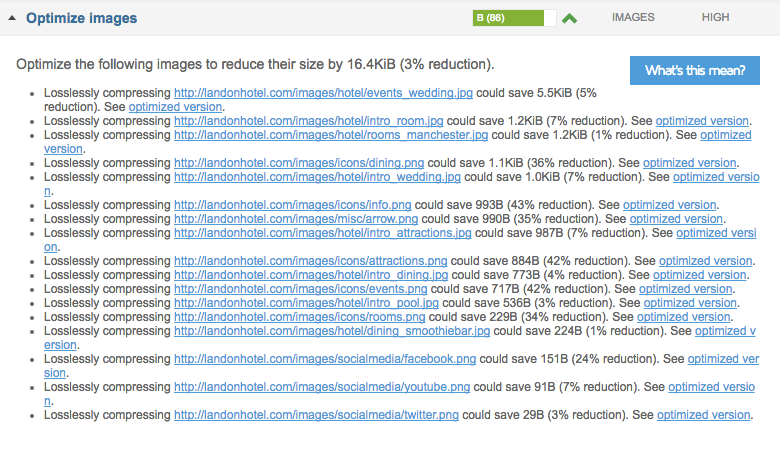 GT Metrix outlines the images that need to be compressed and gives you an optimized version that you can use.
For serving scaled images, we can see what is happening to some of the images on the page that are taking some time to resize before they are loaded. We can resize the images to the exact size needed using a photo editing tool like Photoshop or a free tool like Bulk Resize Photos and upload them back on our site to fix this issue.
Closing Thoughts
Tackling page speed can be overwhelming, especially if you don’t have much technical background in development.
It’s important to understand where the problem areas are with the code and get it into the hands of a developer who can work with you to improve the overall performance of the site.
As an SEO, you should make page speed a top priority. In addition to being a ranking factor, fast page speeds result in a better mobile user experience.
People want and expect fast mobile sites. Make sure your pages are up to speed.
Image Credits
Featured Image: Created by Author
In-Post Images: Screenshots by Author taken May 2017



![AI Overviews: We Reverse-Engineered Them So You Don't Have To [+ What You Need To Do Next]](https://www.searchenginejournal.com/wp-content/uploads/2025/04/sidebar1x-455.png)