Incorporating visual content in your marketing strategy is a great way to cut through the content noise.
While marketers on a modest budget can make room for videos, interactive data visualizations, and full-fledged online courses, cash-strapped bloggers and startups turn to infographics to have a fighting chance.
Not only are infographics affordable, they can also be easily reused across multiple distribution channels — be it through social media, blog posts, and newsletters. This allows you to squeeze the most engagement out of your infographic investments.
The Benefits of Infographics
How come infographics do so well for content marketing?
Because infographics tend to get more engagement on social media than any other form of content. This comes in the form of likes, comments, and shares.
The more social media users engage your post, the more visibility it gets – exponentially increasing your infographic’s reach (and traffic to your site).
Using data visualizations such as timelines, graphs, charts, and diagrams makes complex information more digestible to your audience.

As effective as infographics are for marketing, including them in your strategy isn’t a magic bullet. You should still be prepared to promote them as relentlessly as you can if you want to maximize their success. Of course, you also need to craft them with extra care to ensure their shareability.
Without further ado, below are the strategies you need to remember for infographic marketing.
1. Pick the Right Topic
First and foremost, a well-designed infographic is useless if no one cares about the information it offers.
To get the ball rolling, you can use a content research tool like BuzzSumo to quickly scrape the internet for popular content. Simply type in a keyword that’s relevant to your niche and get searching.
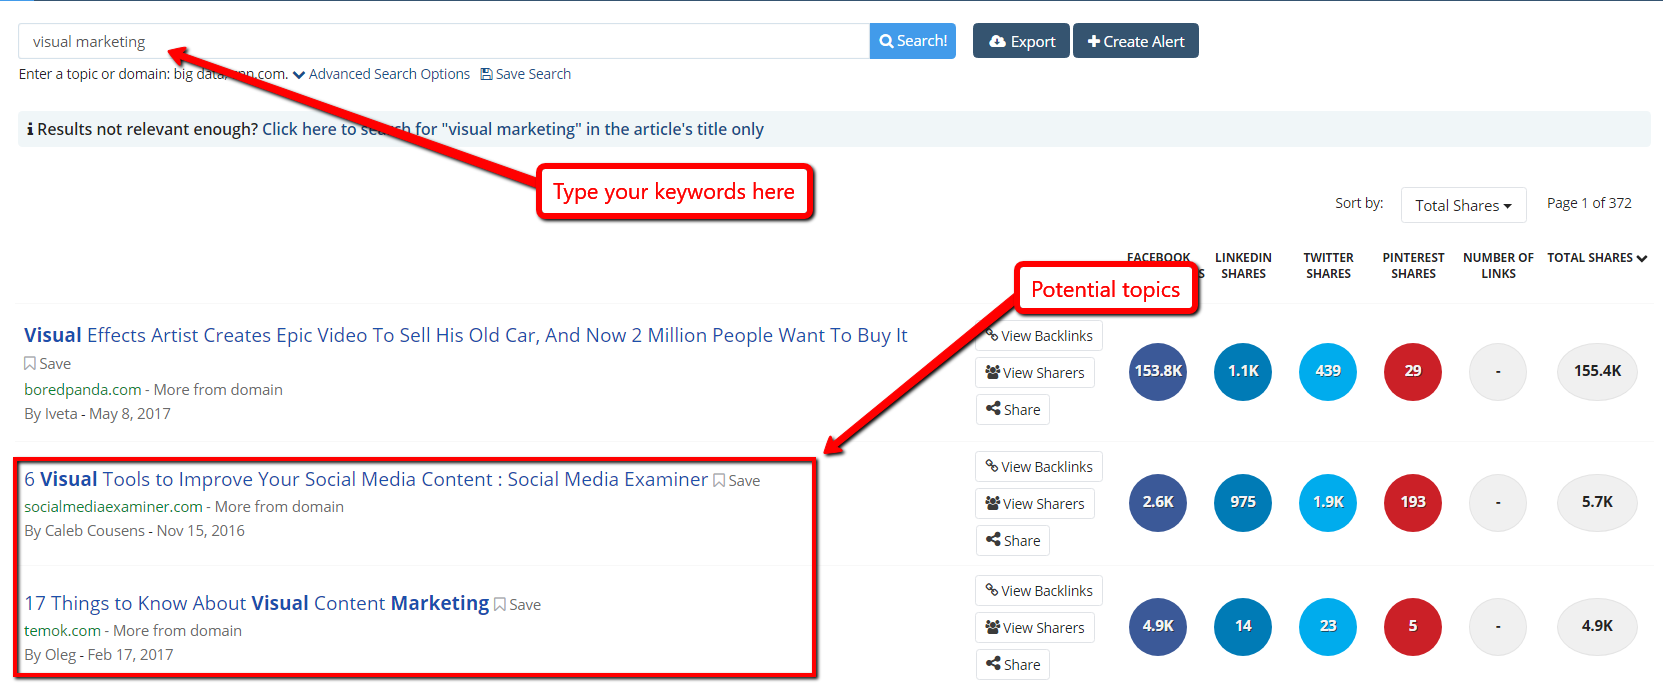
By default, BuzzSumo only pulls articles that are published within the past year. This means you can easily find trending topics, which are either new or has recently resurfaced in terms of relevance.
You can further refine your search using the available settings to the left:
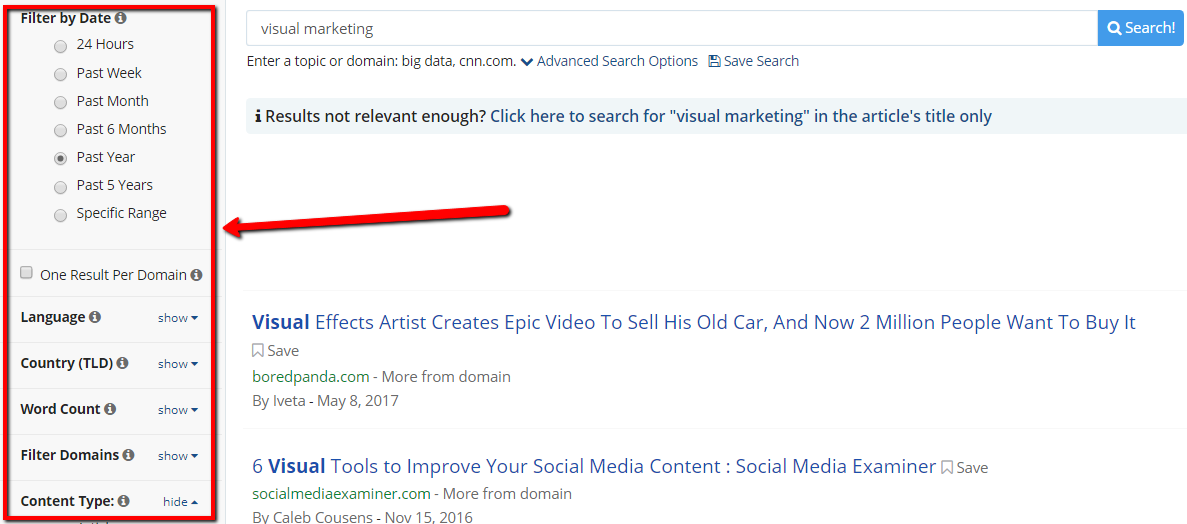
You shouldn’t ignore the number of shares for each post. This will help you gauge how much attention a topic can generate in social media.
If you prefer a specific network over others, simply use the dropdown menu to sort the results:
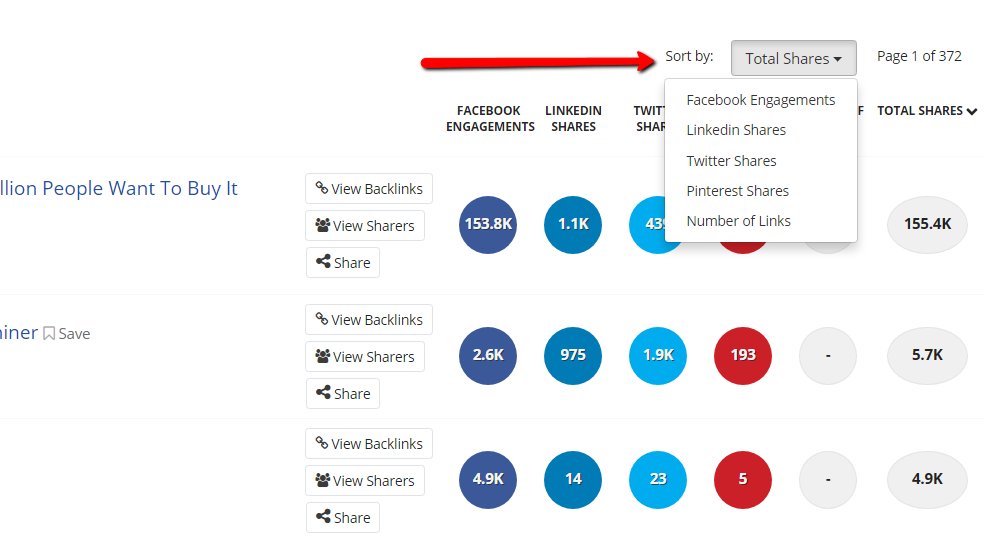
The main advantage of picking a trending topic is that they’re easier to spread through social media. However, trends are often short-lived, and so is the demand for posts that cover them.
That said, you should also be on the lookout for evergreen content, which can generate traffic for a much longer period.
2. Create a Killer Infographic Script
After finding a suitable topic to work with, the next step is to write a compelling infographic script. Remember, the quality of an infographic is determined not only by its design, but also in the way it elaborates information through text.
Here is a breakdown of the important parts of an infographic script and how you should write them:
An Eye-Catching Headline
The first rule of infographic script writing is to use an eye-catching headline. This can be wacky, thought-provoking, or hints that your infographic is written by experts. For example, you can use something like:
“Terrible at Visual Content Marketing? Here are 20 Things You’re Doing Wrong According to Experts”
Feel free to spice up your headline with references to a meme, a celebrity, or anything popular. Just be sure to match your audience demographic and avoid headlines that are offensive, scandalous, or completely unrelated to the infographic itself.
The Introduction
An introduction should be no longer than 3-4 sentences. Its purpose is to build up your audience’s anticipation and set the tone for the rest of the script.
One strategy is to tell the backstory on how you acquired the data for your infographic. For example, did you perform 1-on-1 interviews with the experts? Was it a personal problem that inspired you to conduct your own research?
You can also start with an interesting statistic that directly relates to your target audience’s pain points.
Loads of Data-Driven Content
Data visualizations are the building blocks of a high-quality infographic. Not only do they communicate information more effectively, they also make your infographic more skimmable for those who are doing research.
Before identifying the visualizations you need to use, you must first plan a layout for the infographic’s body. Start by writing a couple of subheadings that pertain to the problem you’re trying to solve, the solution you offer, some examples, and other general information about the topic. This will help you determine what data is needed for each section.
Data Sources
If possible, you should include original data from your own research. Doing so will improve your authority in your niche and your credibility as an information provider.
But if you’re currently incapable of producing any data-based information, then you can always leverage the research done by others. Just don’t forget to cite them at the bottom of each section or by the end of the entire infographic. This will eliminate any doubts on the authenticity of your work.
Additional Tips
- Proofread and polish your script before sending it over to your designer.
- Check if the infographic’s content answers every question raised by the headline.
- Don’t make the script too long. Aim for around only 300-400 words to avoid making the infographic look too busy.
3. Leverage Existing Content Distribution Channels
Just like any other form of online content, you can maximize the visibility of your infographic through distribution channels – starting with your very own blog.
According to statistics, infographics are 30 times more likely to be read than regular blog posts. In other words, forgetting to feature your infographic in your blog is the worst oversight you can possibly make.
Fortunately, you don’t need to do anything fancy to accomplish this step. Simply load your content management system or blogging platform and embed the infographic into a new post. To augment the content consumption experience of your audience, be sure to accompany it with text content that elaborates anything worth explaining.
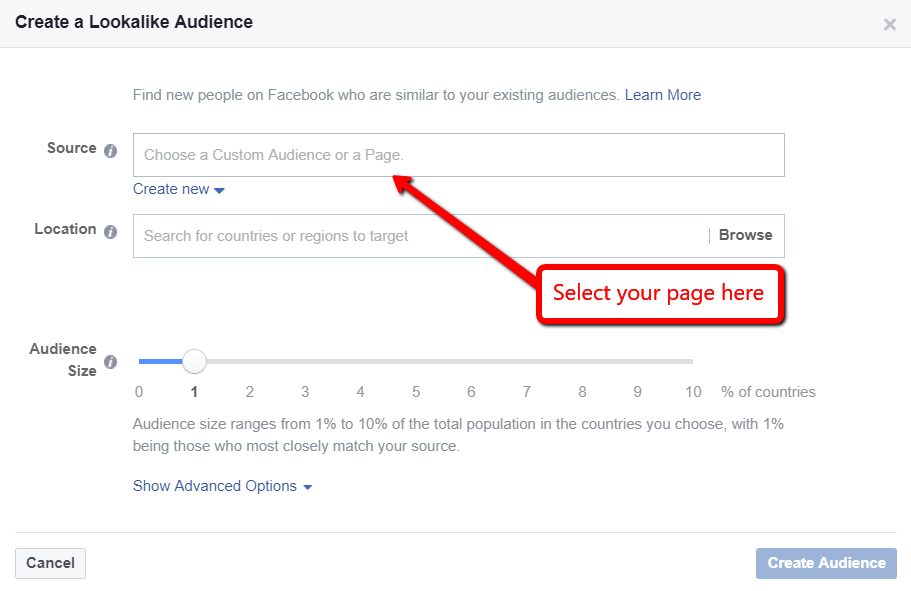
When it comes to social media, consider launching ads to reach people who have similar interests with your existing followers.
Major platforms like Facebook can give you a head start with the option to create a “lookalike audience”. All you have to do is to choose a page with an existing following as the source:
4. Embedding Social Media Buttons
Launching social media ads is only the beginning. To reach even more people, you should also make it easier for your audience to share your infographic.
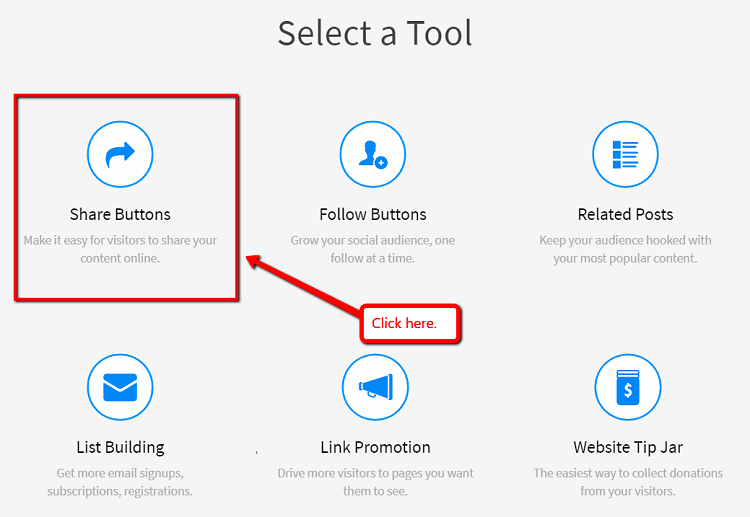
The most straightforward method is to embed social sharing buttons in your infographics with a free tool like AddThis. After logging in to your account, select Share Buttons from the list of available website tools.
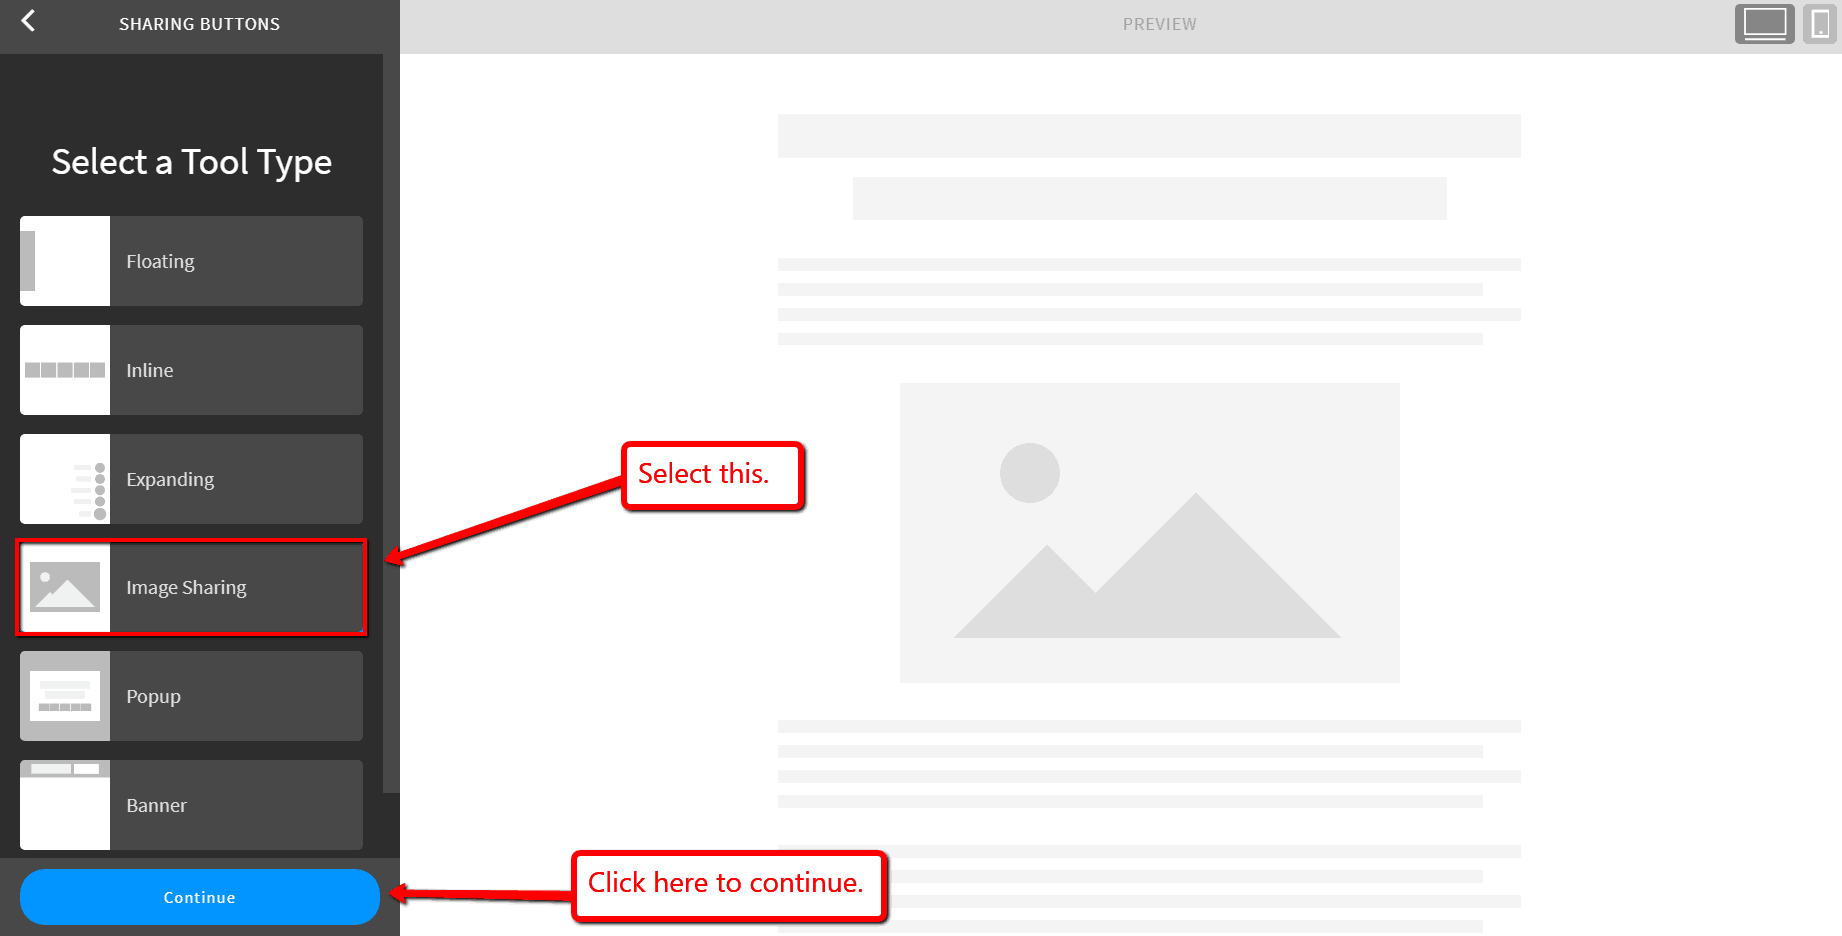
Under “Select a Tool Type”, highlight Image Sharing and then click Continue.
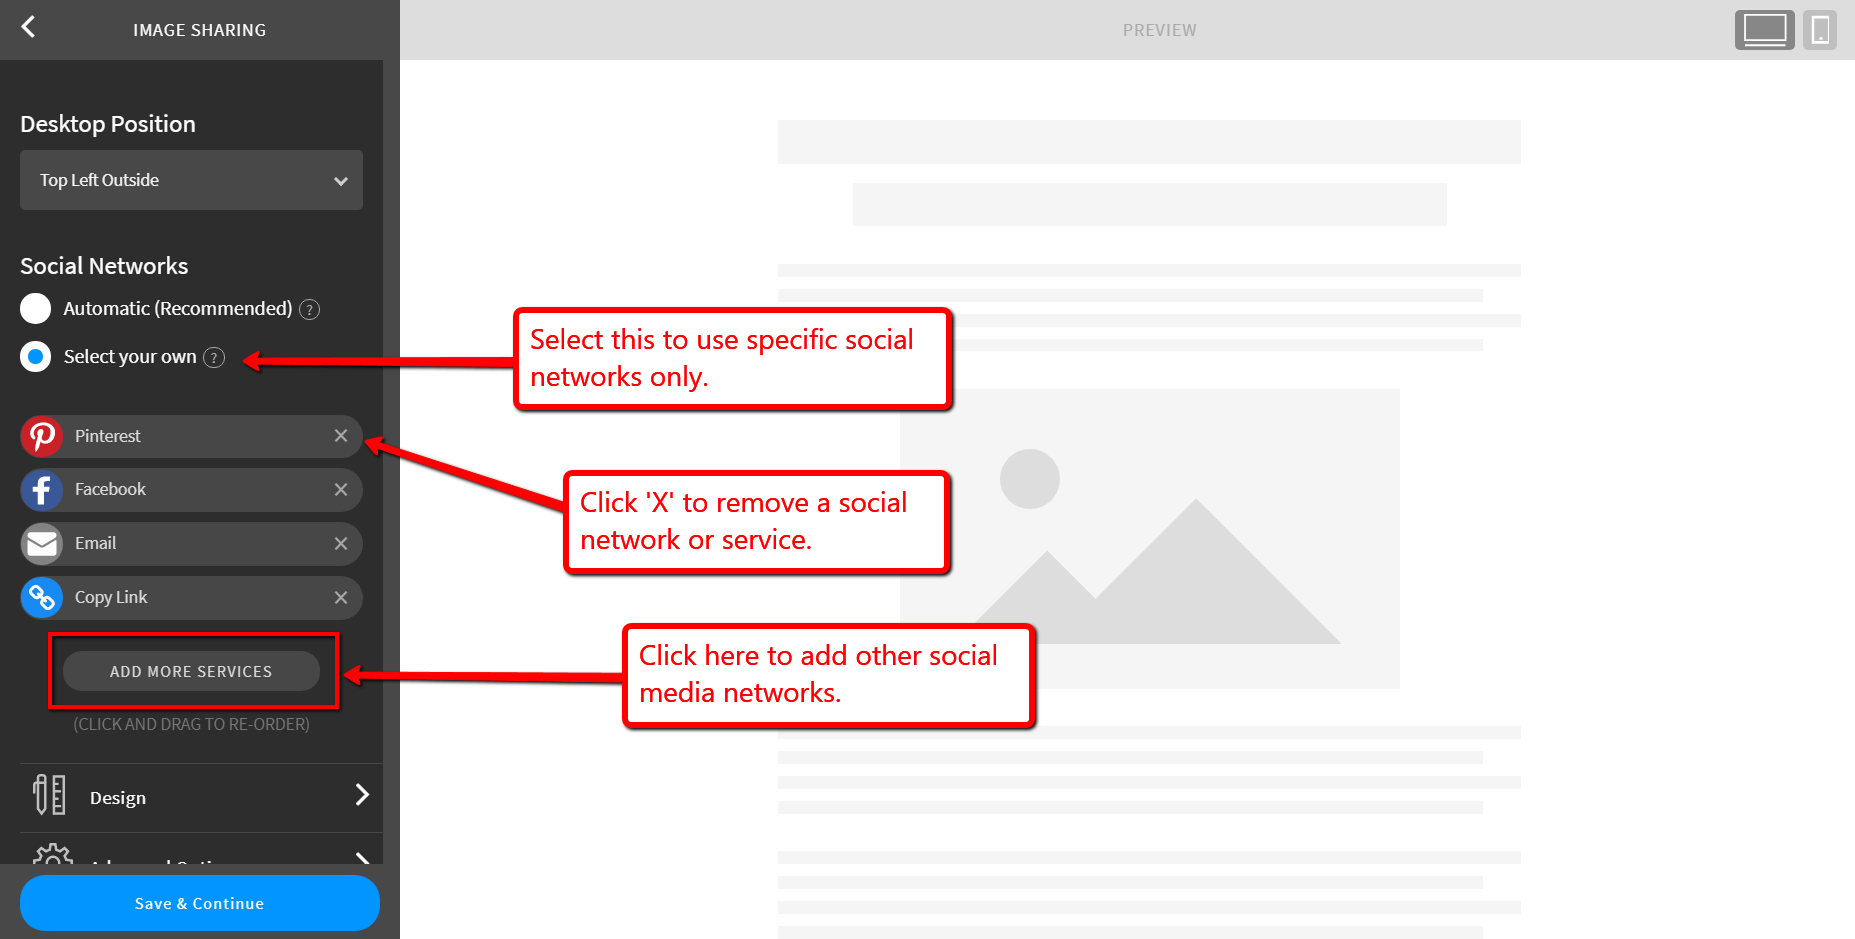
In the visual editor, you can change settings such as the position of the sharing buttons and the available social networks.
If you want to specify the social networks you want to use, highlight Select your own under “Social Networks”.
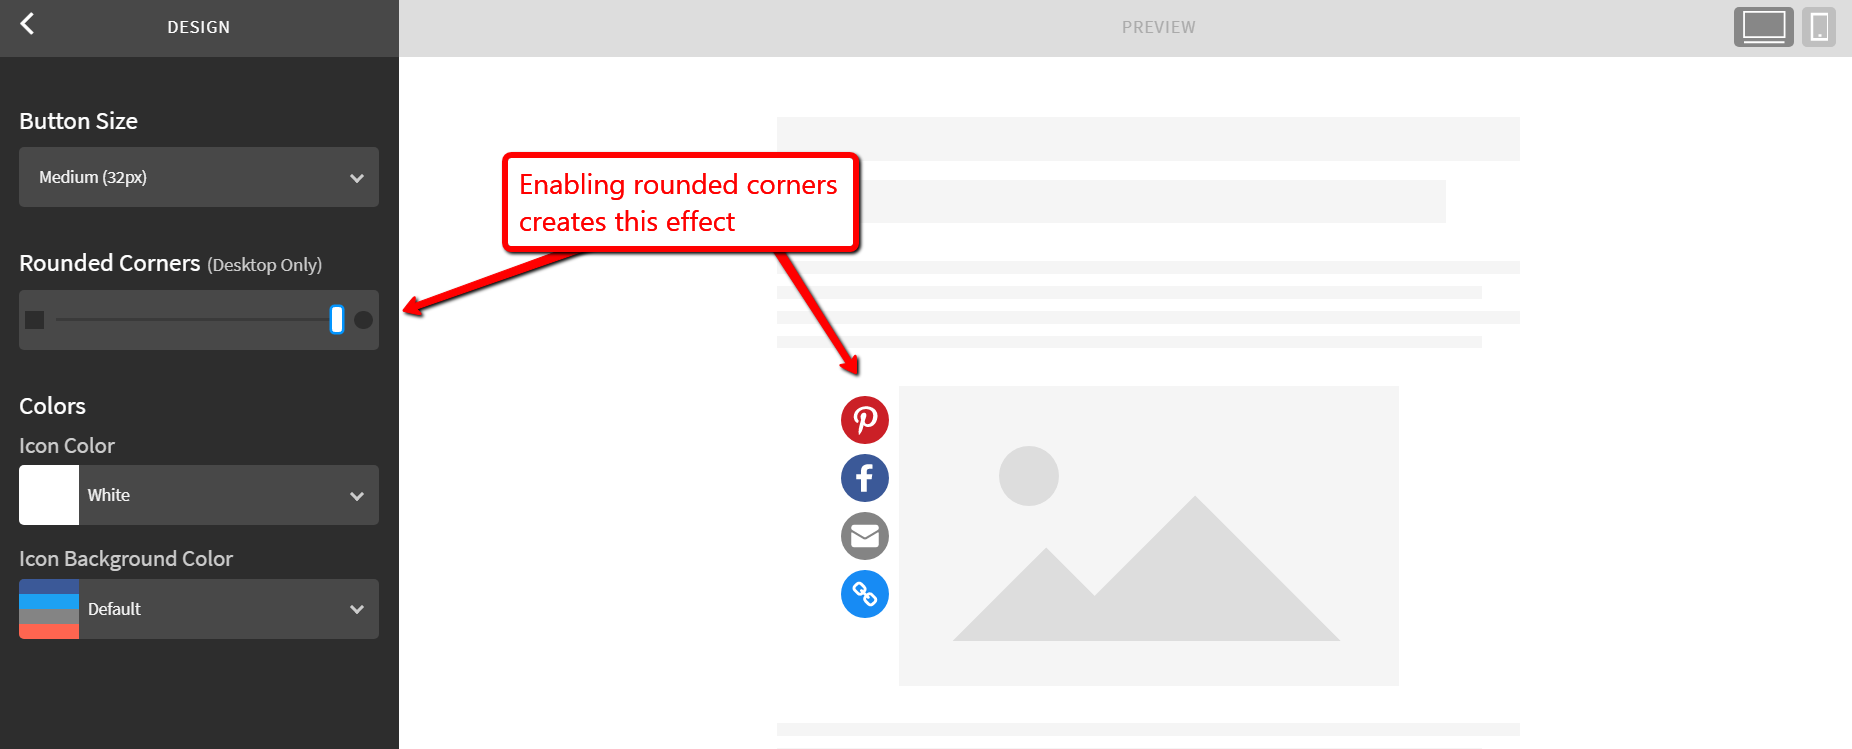
You can also navigate to the Design tab to further personalize the appearance of your social sharing buttons. For example, you can change the button size, corner roundedness, and icon background color.
Feel free to play around with these settings and use the live preview to check which combination works.
When modifying the appearance of your sharing buttons, be sure to match the color scheme and theme of your site. You can also modify the Advanced Options such as the follow-up message, visibility on specific devices, and so on.
Once you are satisfied with your sharing buttons, click Save and Continue for the steps on how to integrate them into your website. For example, if you use WordPress, you can configure AddThis using the Share Buttons plugin.
That’s it! You now know how to make infographics on your site more shareable.
5. Optimizing Infographics for SEO
The next step is to make sure they are also searchable.
Not even the best infographic in the world will take itself to Google’s first page. Aside from accompanying them with SEO-friendly copy, you also need to focus on a few other factors.
Let’s start off with the basics.
Step 1: Optimizing the File Name
Take note that Google uses the file name to give context on what any visual content is about. A rule of thumb is to avoid something generic, like “untitled.png” or a random string of characters that your infographic designer shipped it with.
If, for example, your infographic is about content management systems, then a more fitting file name would be content-management-systems.png.
Step 2: Optimizing the Alt Text
A similar approach can be applied when optimizing your infographic’s alt text — the text that appears in case the image is unable to load. It’s also visible as the ‘tooltip’ when users hover their mouse over the image.
Just like with the file name, search engines like Google also use the alt text to determine the infographic’s topic. You can, however, be as descriptive as you want with your alt text (just don’t go overboard, adding a bunch of random keywords won’t help you).
Step 3: Optimizing the Meta Description
In terms of click-throughs, an infographic’s meta description should be one of your top priorities. Whatever you do, make sure you keep it from 135 to 160 characters in length. This guarantees that your description is displayed properly in search engine results pages.
Since meta descriptions should be tailored to users and not web crawlers, it must provide ample information on what your infographic is about. It’s also a good idea to include your target keyword once for indexibility.
To learn more about the nitty gritty of SEO optimization for images, check out this post.
6. Repackaging Infographics
One of the biggest advantages of infographics is their versatility. They can work with various content ideas, like roundups, reports, and step-by-step guides.
To make an infographic’s message even more impactful, you can repurpose and redistribute them as slideshows. This can be done with a free photo editing application like the GNU Image Manipulation Program or GIMP.
Upon launching GIMP, simply drag and drop the infographic you want to repurpose into the main window.
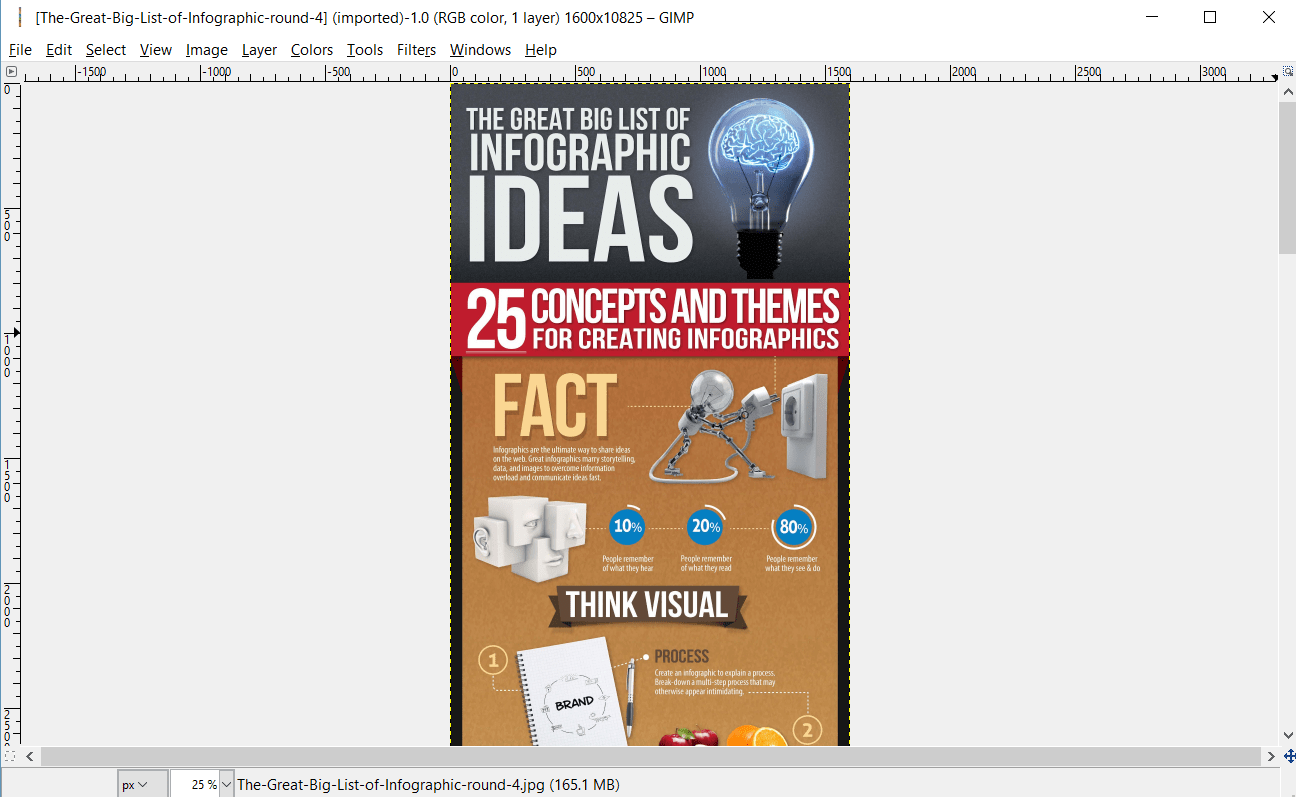
To crop the section, select the Rectangle Select Tool from the main toolbar and drag a box around the desired area.
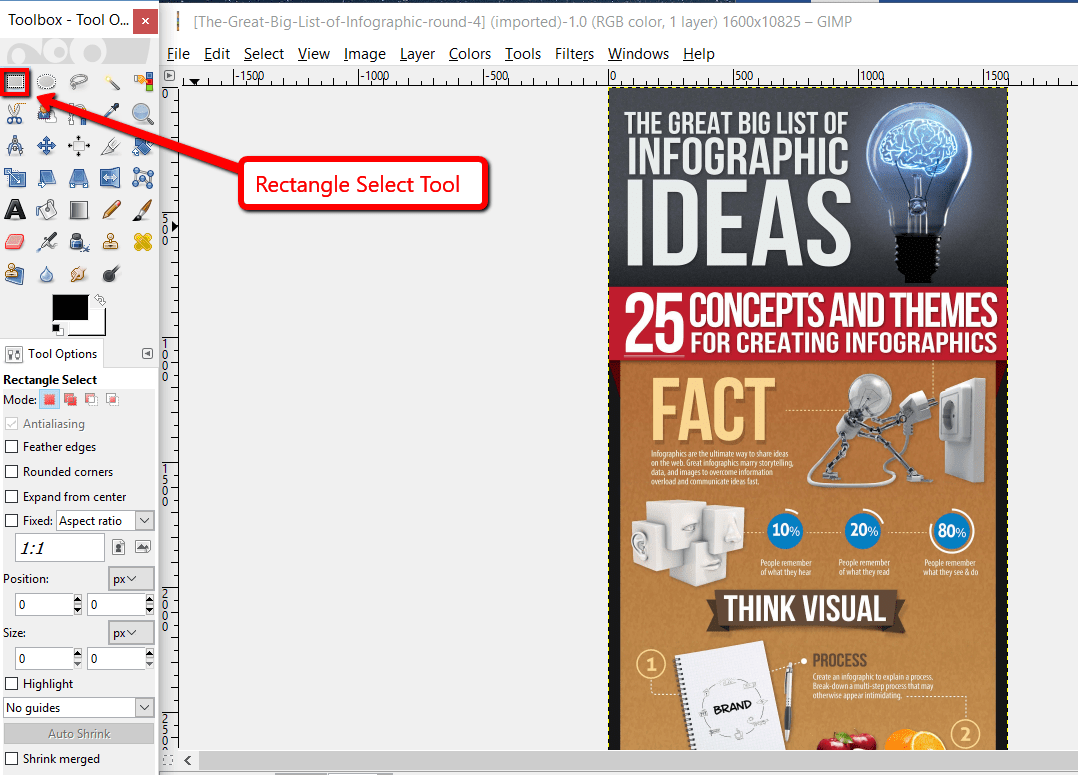
With the desired area selected, click Image > Crop to Selection.
At this point, you can now export the image as a PNG or JPG file by going to File > Export As. Remember to pick a different file name as to avoid overwriting the original infographic.
In the export window, you can configure the quality settings and advanced options for the final output.
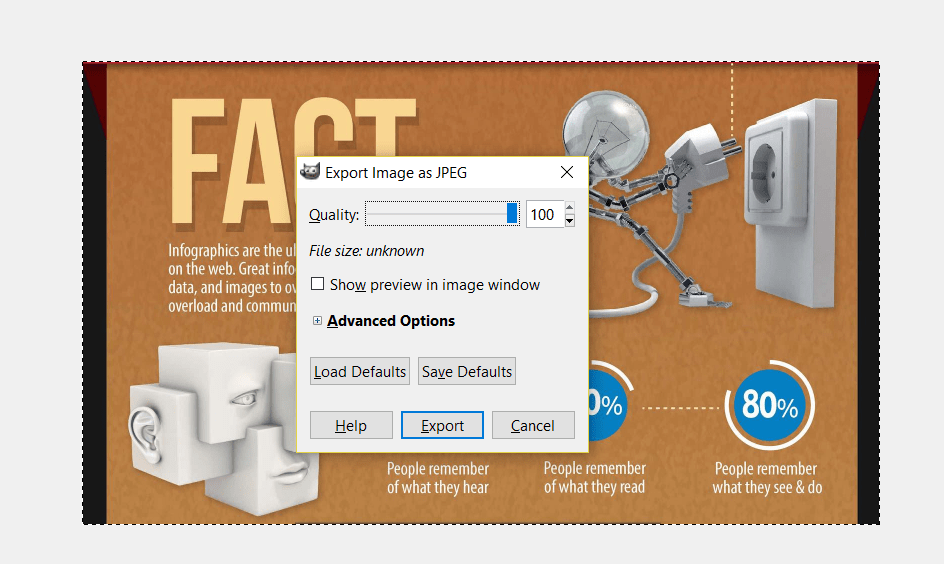
That’s how you can obtain individual slides for your would-be presentation. Simply undo all your changes and start over from the top, exporting each slide into individual image files as you go.
The slides alone can be individually shared on social media for more traffic. But when it comes to promoting the whole slideshow, you can leverage an online presentation platform like SlideShare. Doing so makes your presentation more discoverable to the online audience, particularly to the LinkedIn community.
If you want, you can also incorporate them in your webinar strategy with a platform like ClickMeeting, which allows you to showcase presentations as you interact with a live audience.
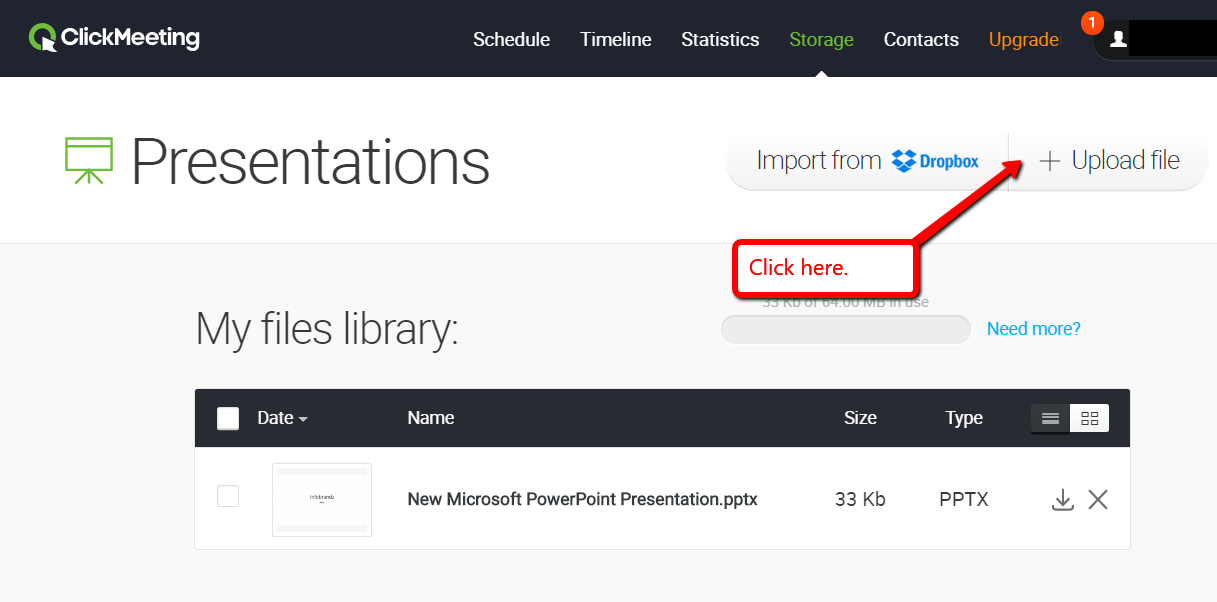
To import presentations to ClickMeeting, log in to your account and head to Storage > Presentations. Click Upload File and look for the presentation you want to use.
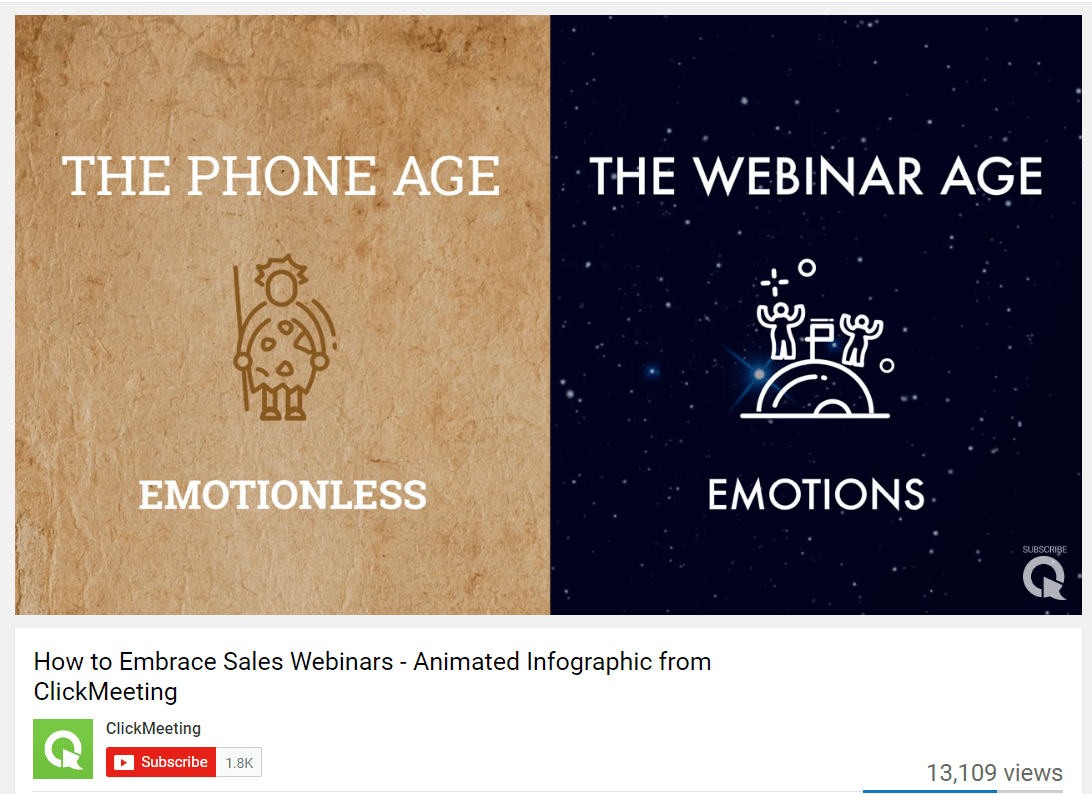
If you have the budget, you can also use the cropped materials for an animated video. ClickMeeting utilized this strategy for their infographic on developing more interactive, emotion-driven sales experiences.
Bonus: Submitting to Infographic Directories
You can maximize the online reach of your infographics by submitting them into directories. Not only will this lead to increased traffic, it can also generate a ton of feedback and insights from the online audience.
This is, by a clear mile, the easiest tactic.
To get you started, here are some of the most popular infographic directories that accept submissions:
- Reddit Infographics
- Flickr Info Graphics Group
- Submit Infographics
- Infographix Directory
- Infographic Archives
More Visual Content Marketing Resources:
- Visual Content Marketing: 10 Brilliant Examples
- Link Building With Infographics? Try This Instead
- How Visual Listening Can Turn Selfies Into Sales
Image Credits
Featured image: Pixabay
In-post photo: FirmBee/Pixabay
Screenshots captured by Vikas Agrawal on July 2017.


![AI Overviews: We Reverse-Engineered Them So You Don't Have To [+ What You Need To Do Next]](https://www.searchenginejournal.com/wp-content/uploads/2025/04/sidebar1x-455.png)