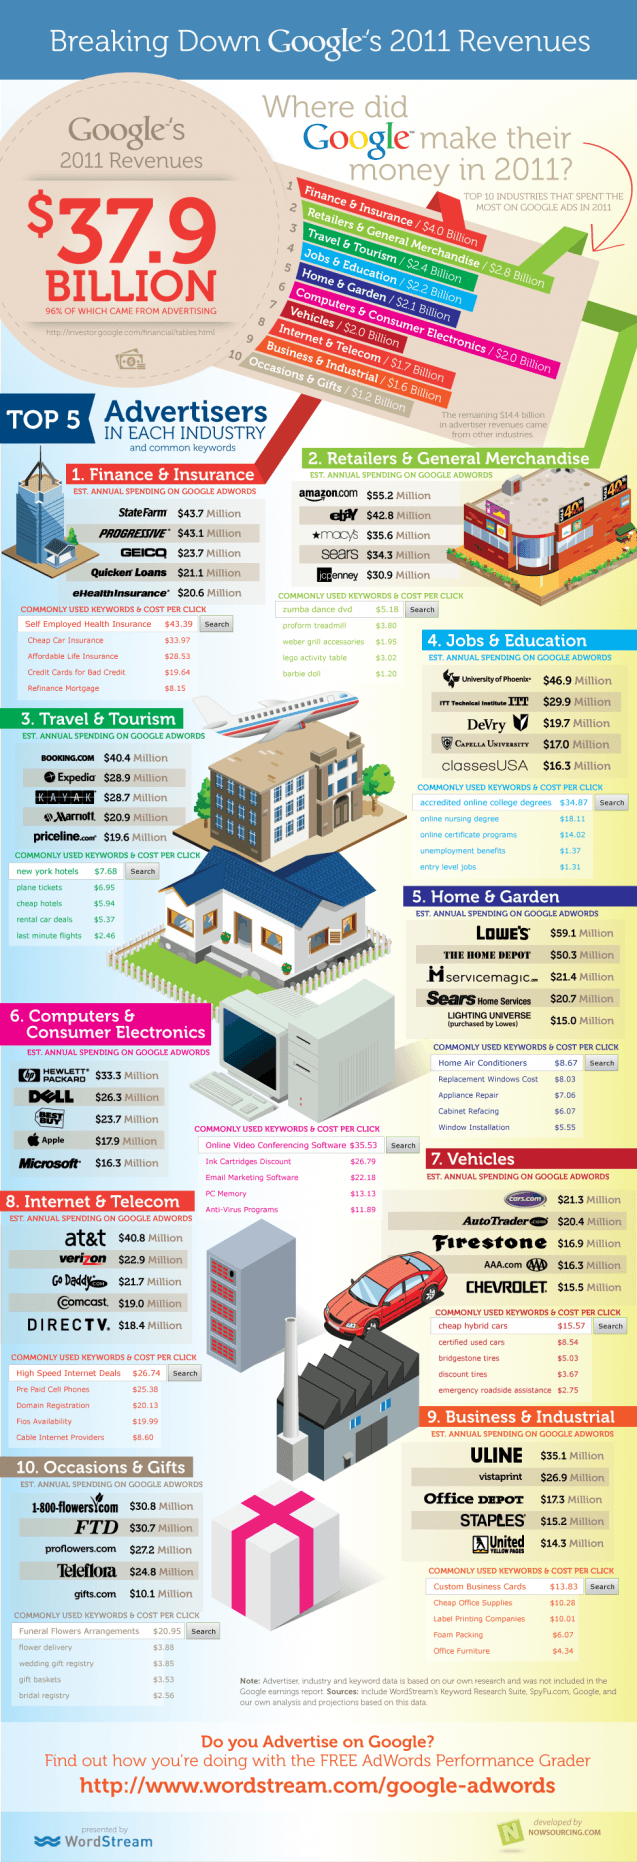
Did you see Google’s “disappointing” #37.9 Billion 2011 earnings announcement for their 2011 ad revenues? Ever wonder which industries contribute the most to Google’s ad revenues? The findings are summarized in this cool new Infographic by Wordstream. What can your clients learn from these numbers?

“This is all original research – Google doesn’t provide a detailed industry/company breakdown of where their revenues come from. And the results give some insights into the state of the economy and the strength of our online marketing industry.” – Wordstream
- Finance & Insurance – $4.0 Billion (example keywords in this industry include: “self employed health insurance”, “cheap car insurance”, “credit cards for bad credit”)
- Retailers & General Merchandise – $2.8 Billion (example keywords in this industry include “zumba dance dvd”, “proform treadmill”, “weber grill accessories”)
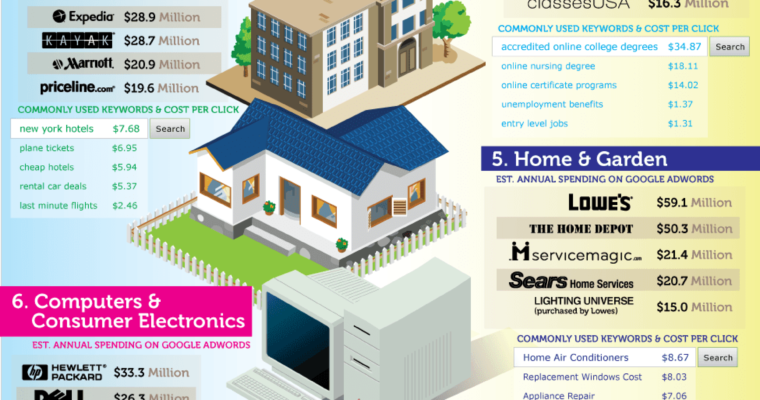
- Travel & Tourism – $2.4 Billion (e.g. “new york hotels”, “plane tickets”, “rental car deals”)
- Jobs & Education – $2.2 Billion (e.g. “accredited online college degrees”, “online certificate programs”, “unemployment benefits”)
- Home & Garden— $2.1 Billion (e.g. “replacement windows cost”, “appliance repair”, “cabinet refacing”)
- Computer & Consumer Electronics – $2.0 Billion (“ink cartridges discount”, “pc memory”, “online video conferencing software”)
- Vehicles – $2.0 Billion (e.g “cheap hybrid cars”, “certified used cars”, “bridgestone tires”)
- Internet & Telecommunications – $1.7 Billion (“pre paid cell phones”, “domain registration”, “cable internet providers”)
- Business & Industrial – $1.6 Billion (“custom business cards”, “cheap office supplies”, “foam packing”)
- Occasions & Gifts – $1.2 Billion (“funeral flowers arrangements”, “flower delivery”, “wedding gift registry”)


![[SEO, PPC & Attribution] Unlocking The Power Of Offline Marketing In A Digital World](https://www.searchenginejournal.com/wp-content/uploads/2025/03/sidebar1x-534.png)