This is a sponsored post written by Supermetrics. The opinions expressed in this article are the sponsor’s own.
Every day marketers spend hours creating reports in Excel. Not only is the task extremely tedious, but the chances of mistakes are also high, especially if you’re doing a ton of month-end or year-end analytical reports.
Yet, Excel is still a great tool for reports because everyone knows how to use it, and you can easily share the reports with every member of your team and your stakeholders.
So, the question becomes: is there an easier way to leverage Excel for your reports, but make the process more streamlined?
Let’s first, however, dive into whether you still should be using Excel for your reporting needs.
Is Excel Still Good for Marketing Reporting?
While Excel wasn’t necessarily built with marketers in mind, everyone uses it – especially in larger companies. Microsoft Office is one of the most commonly used products within an office setting, so it’s often the go-to reporting suite for in-house marketers.
Excel is more powerful than other spreadsheet tools in several ways. It can handle large data files with billions of cells while other tools are limited to millions of cells. In fact, other tools might slow down or crash if you try to load too much data into the sheet.
Further, Excel stands out when it comes down to features, formulas, and add-ins. It offers advanced add-ins like Power View for creating interactive charts and Power Query for data manipulation.
And, yes, it does have its drawbacks, but those can be overcome. Plus, many companies still frown on cloud-based products due to security concerns. Therefore, Excel winds up being everyone’s go-to product.
So, What Are the Challenges?
As a marketer, you often need to prepare reports on a regular basis, be it ad hoc reporting or full monthly reports. The data collection phase takes a great deal of time. And, this data has to be imported into a single system.
The problem is this: campaigns are run on multiple platforms by different companies and channels. Pulling all of this data into a single source can be problematic.
For example, if you are obtaining reports from Google Ads, you can just download that, but you also want to compare that campaign with a similar one that you’re running on, say, Facebook or Bing to determine how well your Google efforts are matching up against the rest.
Now, you have to manually type in all that data into Excel – which is a slow, tedious process and is fraught with the potential for mistakes from fat fingers.
So, we have an additional challenge on our hands: you need to get the extra data from all these sources as quickly as possible. Excel doesn’t make this easy to do.
Add to this the issue that you might want to look at a particular time span or compare user segments. In this scenario, you have to download the individual information, pull it into a single tab, and then create functions to compare all the various sources. This takes a lot of time.
Yet, what if you need to do all of this within a limited time frame because you have a big meeting at the last minute? It could be near impossible to do. And, when you try to do things quickly, you increase the chances of mistakes.
Most people believe that they don’t have any other choices except this. Or, they might be talked into an expensive data collection and analysis system.
However, most marketers don’t have the budget – or can’t get permission to buy it.
So, what are your options if you want to speed up the data collection and analysis process?
How to Create a Marketing Report in Excel with Supermetrics
We at Supermetrics completely understand the pain of marketers who have to manually pull data from a number of different sources, which is counter-productive, error-prone and probably the most boring part of their job.
This is why we have developed an Excel add-in which allows to effortlessly create reports with metrics from all the major marketing platforms.
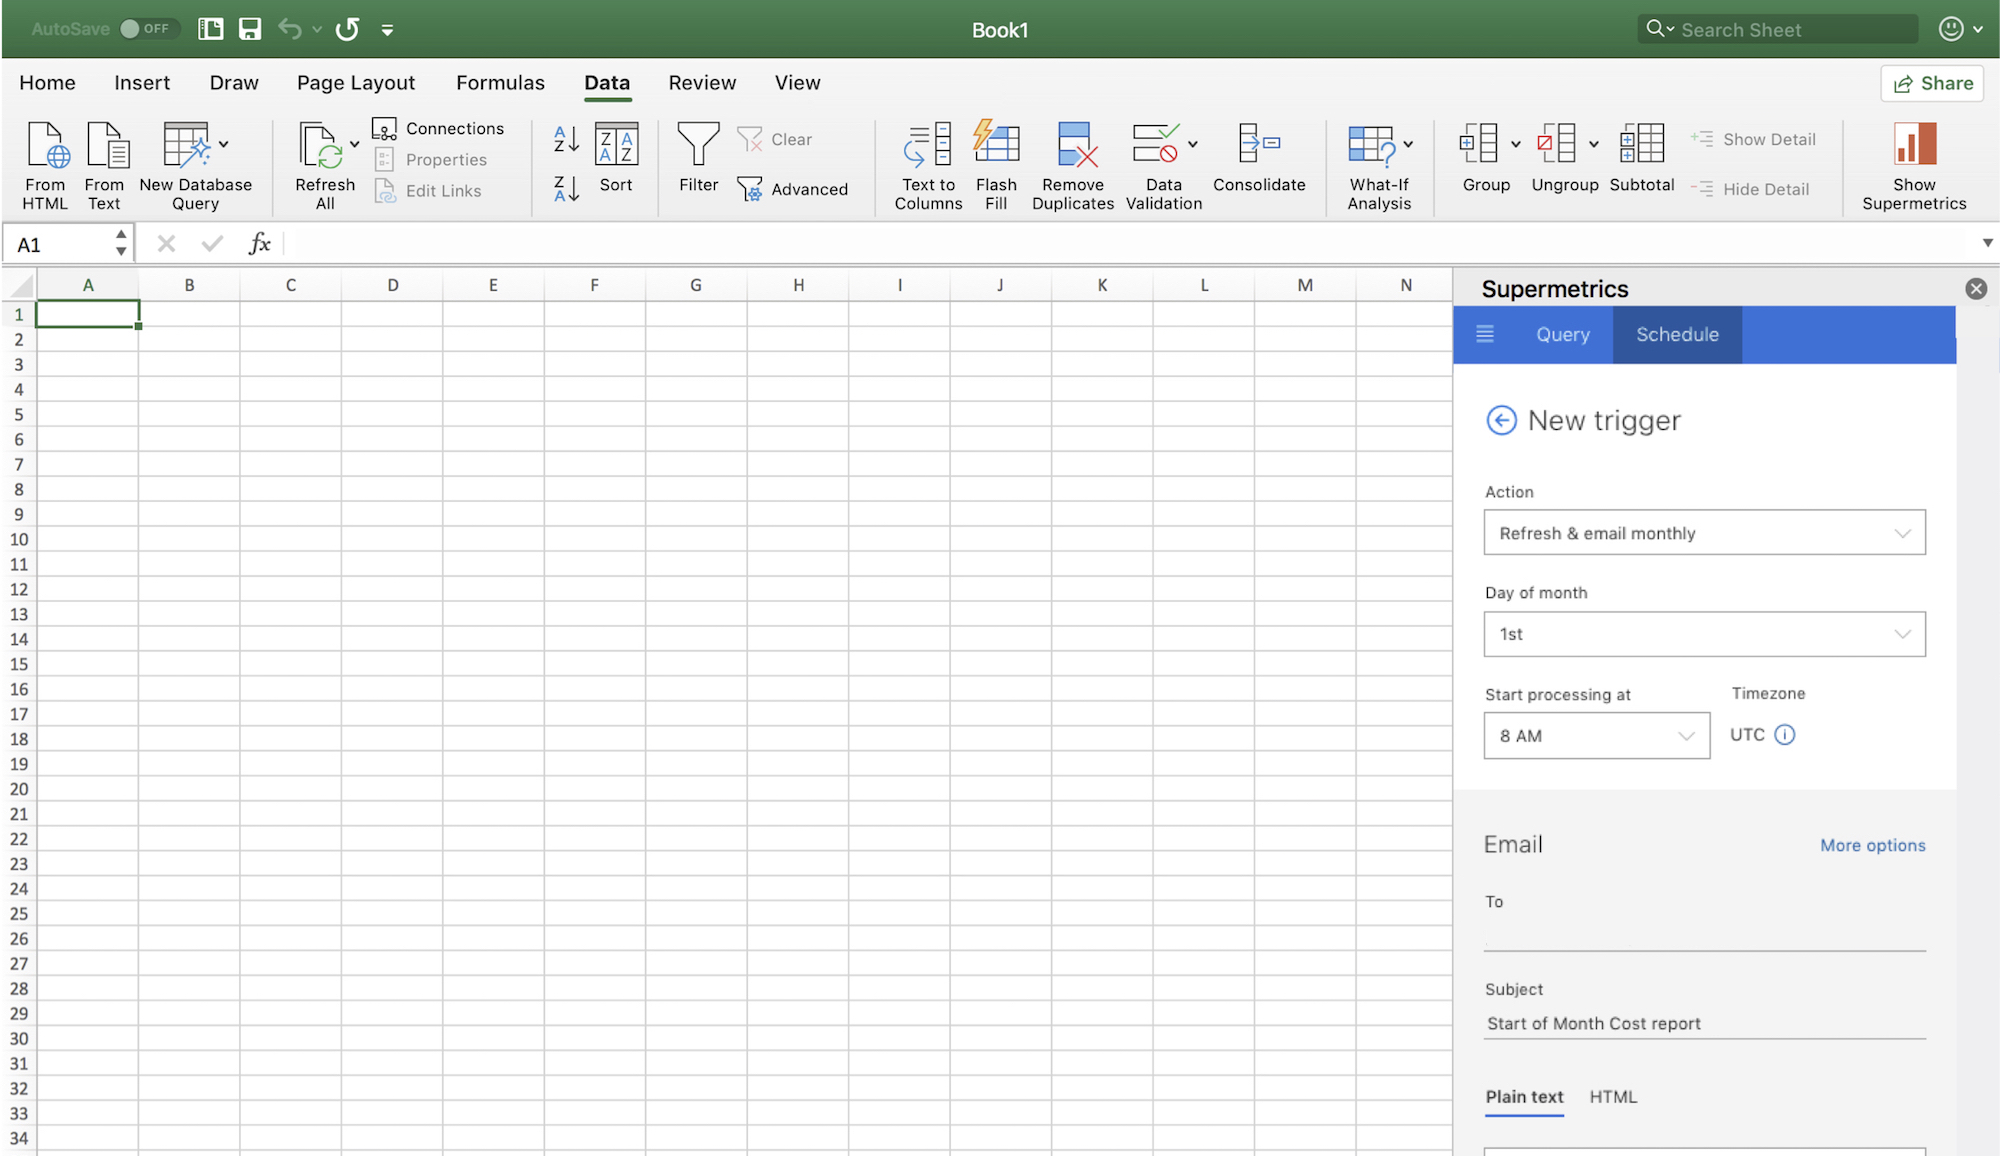
After you have downloaded and opened the add-in, you will see the sidebar on the right.
With the help of the intuitive sidebar UI, you can pull the data you want from any major marketing platform and turn the data into exactly the form you need in seconds. No VBA or coding knowledge is required.
After the metrics are pulled and the reports are created, you can automate the data refresh and email the reports by setting up triggers.

Additionally, you can get the data while you’re online and then edit the report offline. No need to store the data online. If you work in a bigger company with strict security policies, this is a huge plus.
Here is what Duane Brown, CEO of Take Some Risk Inc., is saying about Supermetrics for Excel:
“Supermetrics for Excel made reporting and analysis of marketing campaigns a breeze! It saves us a huge amount of time, allows us to easily get all of our marketing data in one place, and provides our clients with the transparency and insights they really appreciate.”
Try It for Free & Start Saving Time Today!
It all boils down to one question:
Would you want to use hours of your time manually pulling data into Excel, or would you rather spend that time on more valuable tasks like extracting insights and optimizing campaigns?
If your choice is the latter, try Supermetrics for Excel for free today!
Automate all your reporting. Work smarter, not harder.
Image Credits
Featured Image: Image by Supermetrics. Used with permission.
In-post Video #1: Image by Supermetrics. Used with permission.
In-post Photo #1: Image by Supermetrics. Used with permission.


