Dynamic Remarketing With Precision Remarketing Lists
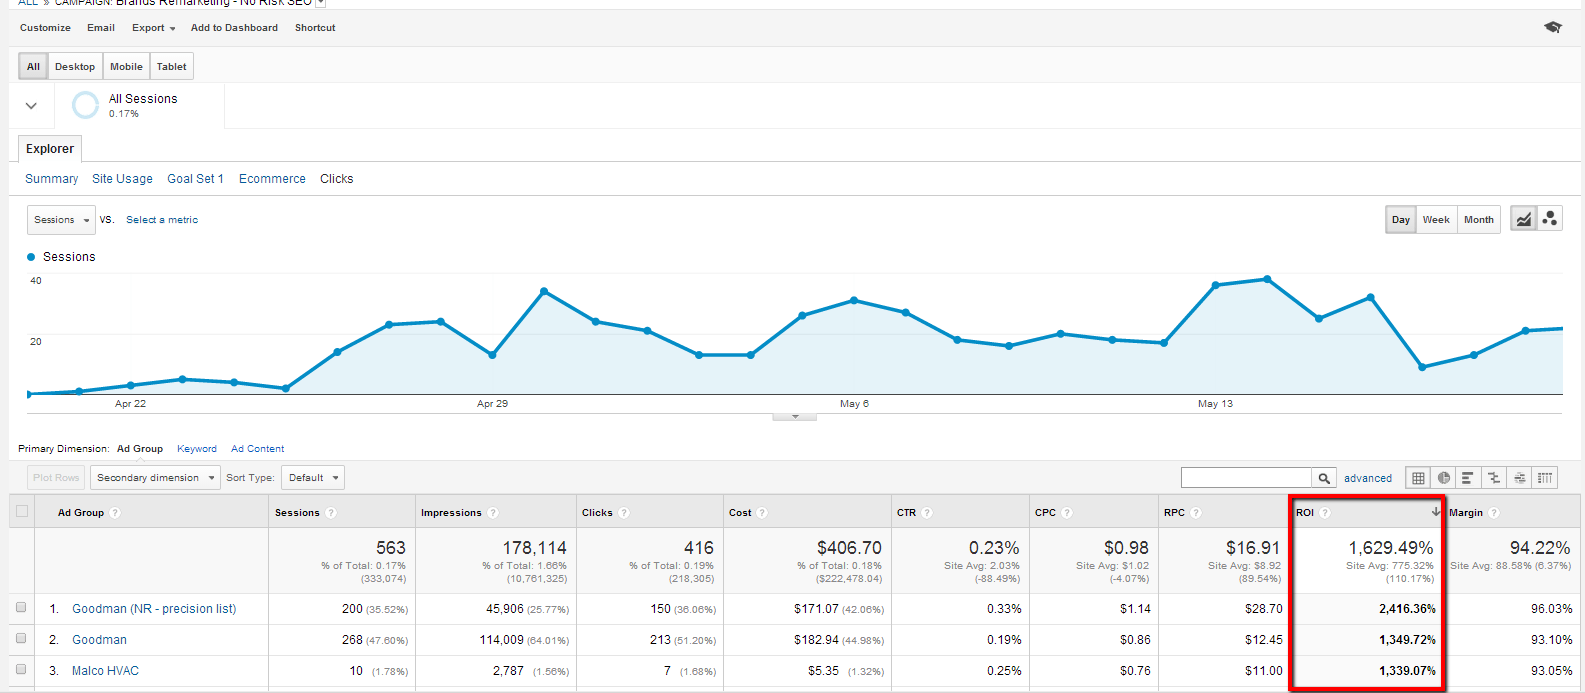
For those of you who read my last post, I finally have collected about a month worth of data after setting up that laser targeted remarketing campaign. The ROI is peaking at 2400% ROI for some of the ad groups and the ROI of the entire campaign is averaging well over 1600%. These types of numbers are impressive but it’s never enough. So my next step is going to be fine tuning the campaign to get that ROI to go even higher! 🙂
For those of you who did not read my last post, I explained how to setup highly targeted remarketing lists for a dynamic remarketing campaign with Google Analytics. The campaign was setup with a brand-intrinsic ad group structure meaning each ad group was geared towards a specific brand of products they sold on their eCommerce website. The case study is being done for a client of ours that has been working with us for about three months. Currently, we are only providing them with PPC management services, but soon we will be starting the organic campaign and I will also provide a case study on how to improve your eCommerce website’s organic traffic by optimizing your product pages.
Month 1 – Analyzing The Data & Benchmarking to Improve
This particular client sells heating and cooling parts from many of the manufacturers like Goodman, LG, and Mitsubishi. After letting the campaign run for about a month we can see the ROI for the campaign is very favorable as shown below. Obviously some ad groups are performing better than others, but the entire campaign is performing fairly well for the first month. There are many ways to measure the performance of your PPC campaigns and I find the Adwords click report to be the quickest and easiest to use.

Screenshot taken of www.google.com/analytics 5/26/2014
Bearing in mind that this is a very small data sample, I decided to bench mark the performance of the brand specific campaigns by creating an annotation. It is clear that a majority of the conversions are coming from the most popular brand, Goodman. I am going to try and create more ad groups for the brands that are not as popular in hopes that after getting several ad groups running we can start to get more revenue from the larger amount of ad groups running. When the campaign was setup we only created ad groups for about 30 percent of the brands they carry. We still have many more ad groups to create but now that we have a small data sample we know that there is a lot of potential with dynamic remarketing with precision based lists for this client.
Understanding How Remarketing Plays a Role in The Conversion Process
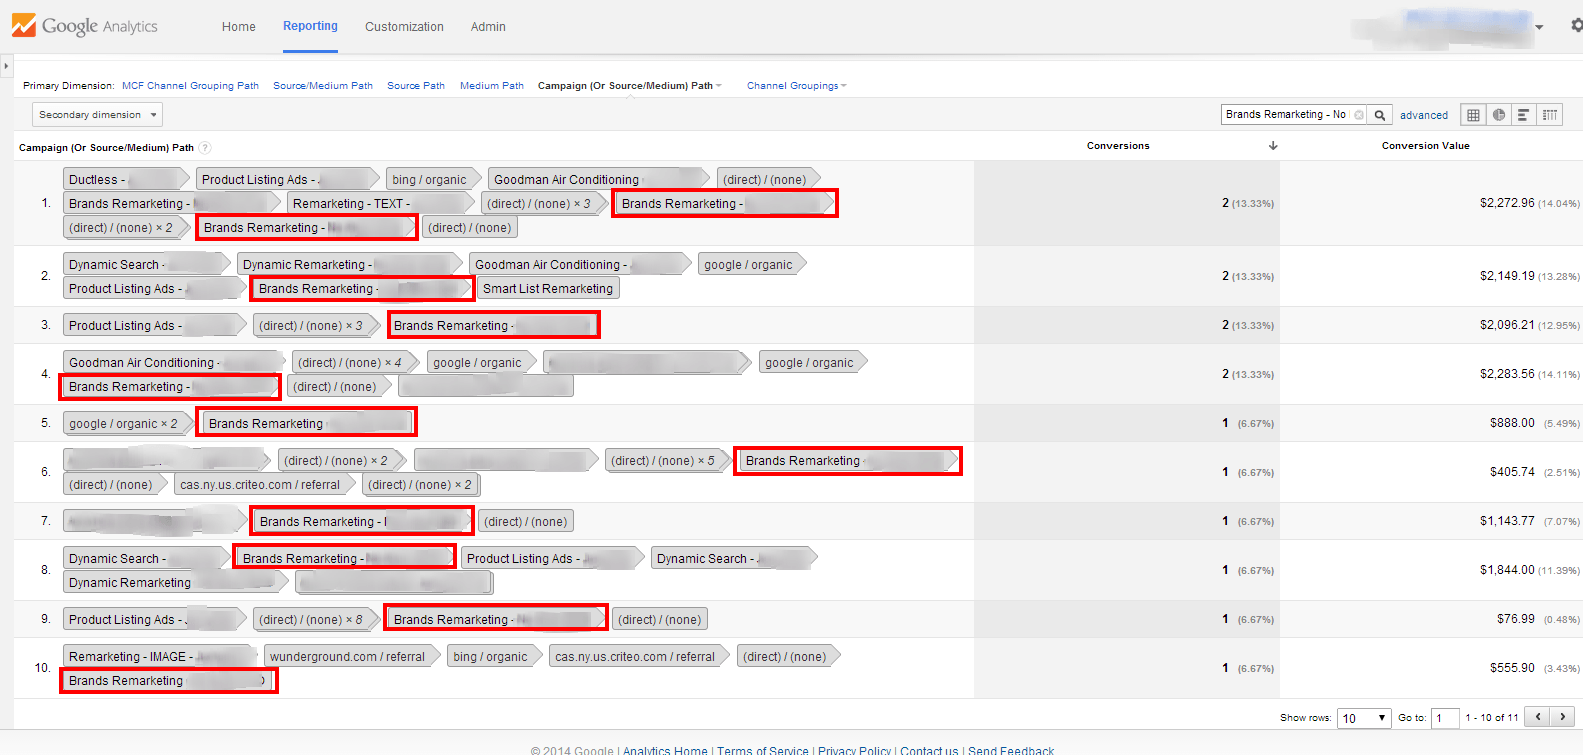
As a marketing analyst for a PPC management company, I often like to make use of the multi-channel funnel reports in Google Analytics because they can provide you with a lot of insightful data. One report that I decided to take a look at was the top conversion paths reports which visually outlines what medium/source paths are used by the visitors who converted after using multiple channels to find your site. Here we can see how the many different marketing channels are playing a role in each conversion and other great insights like revenue data and conversion rate. Below you can see a report that I created using “Campaign (Or Source/Medium) Path” as the primary dimension and then using the quick filter to only show the dynamic remarketing campaign. Using the quick filter search field is a great way to strip out unwanted data with ease and I often use this to hone in on data that is relevant.

Screenshot taken of www.google.com/analytics 5/26/2014
The dynamic remarketing campaign was used in 11 different conversion paths according to the above screen shot, and you can see how the campaign is almost always used in the last two interactions. This is a sign that the campaign is doing its job well because the whole idea behind dynamic remarketing is to remind the visitors who were about to convert that they should return to the website to finalize their shopping. The ads are structured according to the pages the groups of visitors (who are thrown into remarketing lists) have navigated to. Ideally, your ads are going to show ads relevant to the user’s interest based on the content they’ve seen on your site. In this case, we made ads that were based on brands according to the different product pages the remarketing list members have viewed.
Keep on Optimizing!
Like spider man said, with great campaigns comes great responsibility, so we are going to continue optimizing this campaign to get the most from it. The next step is to create banner ads that are more compelling to increase the conversion rate. Optimizing your banner ads is a very effective way improve conversion rates for remarketing campaigns. We do this in many ways, sometimes by offering a small discount on the advertisement or building a sense of urgency by saying “only a few units left”.
We also sometimes use a strategy that involves creating discounts that increase in size over time. For example, we use ads in the first week that don’t have a discount then add a 5% discount to the banner add in the start of the second month. The third month we might increase that discount to 10% if margins allow it. The point is to keep working on the ad groups to maximize your ROI.
From our experience we have seen that the more granular you get the better the ROI will be. We will be presenting another case study when we have enough data from the product specific ad groups we setup in the next few weeks to come. Until next time, thanks for reading and feel free to leave and comments or questions in the comments section below!


