Change is hard. I get it.
And functionality is important. I get that, too.
For these reasons and more, Google Analytics 4 was a bit disappointing at first. On the surface, it just didn’t seem to have much to offer — not enough to justify the change, anyway.
However, we’re now closing in on a year that it’s been out and are finally starting to see some promising features. Here are 7 things you can do in GA4 that may help you hate the transition a bit less.
Getting Started with GA4: Google Analytics 4 Features
- Predictive analytics.
- Create custom reports.
- Create and track up to 300 Events.
- Create and track up to 30 Conversions.
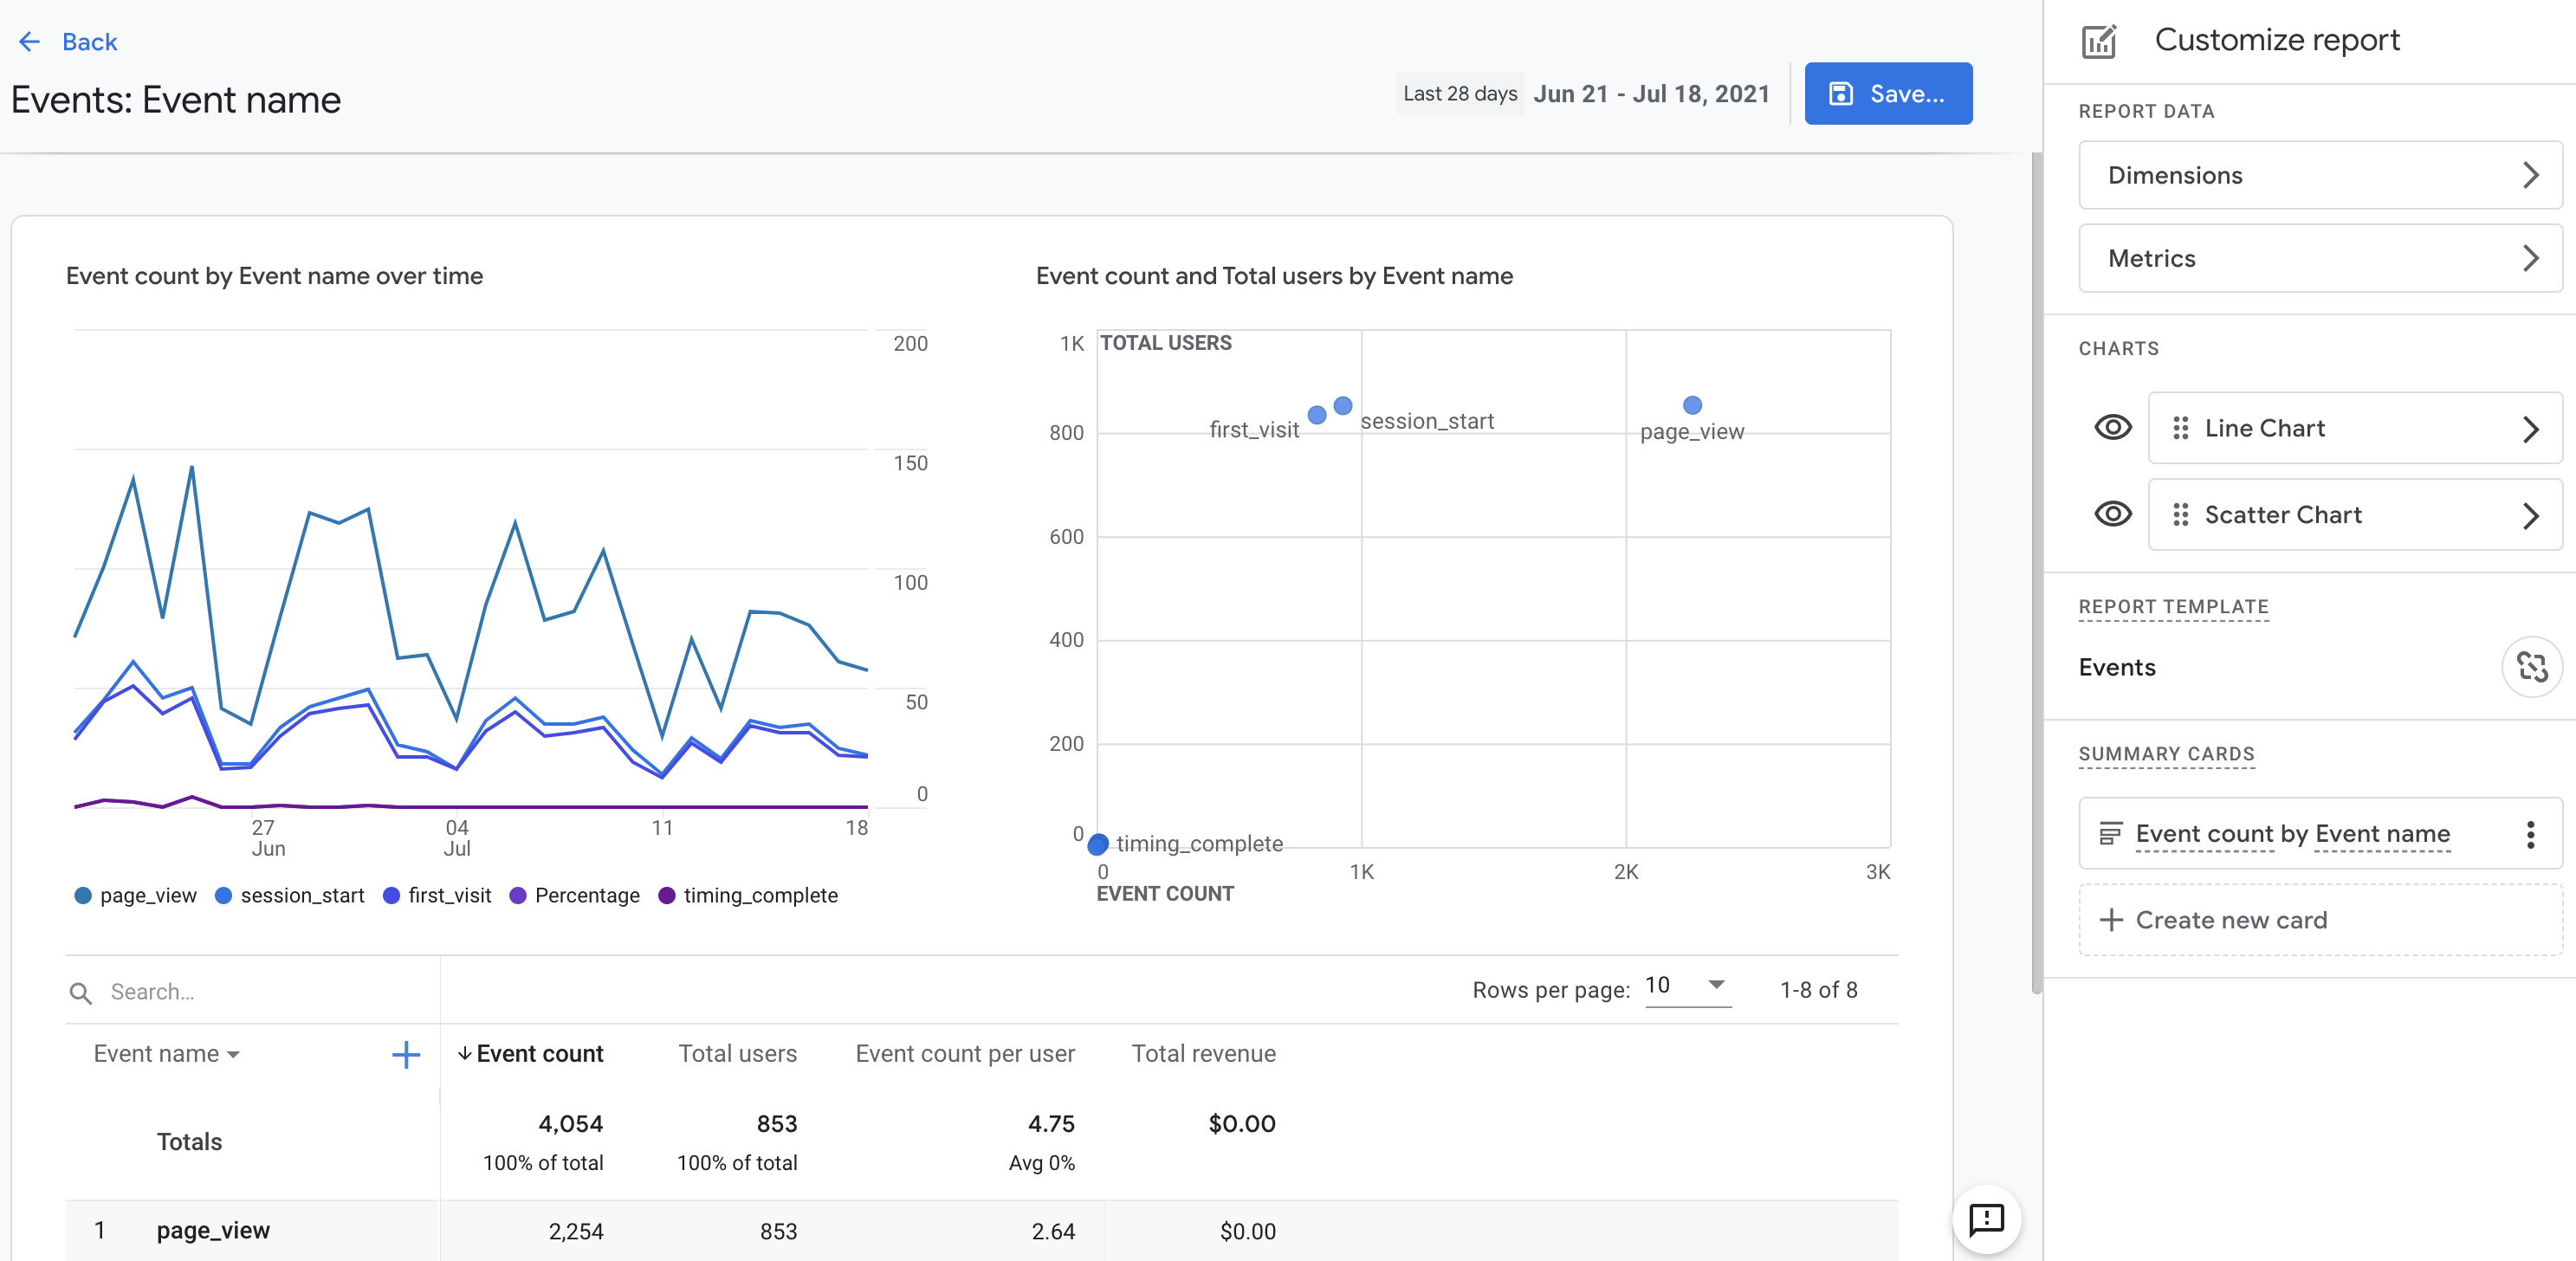
- Customize automated tables.
- Anomaly detection.
- Easily create Audience Segments.
1. Predictive Analytics
Google Analytics 4 was initially dubbed “The Future of Google Analytics.” And honestly, I’m kind of excited about this.
GA4 is jam-packed with machine learning and artificial intelligence.
Now, this isn’t to say Universal Analytics doesn’t have any ML or AI. But it’s far more useful in GA4.
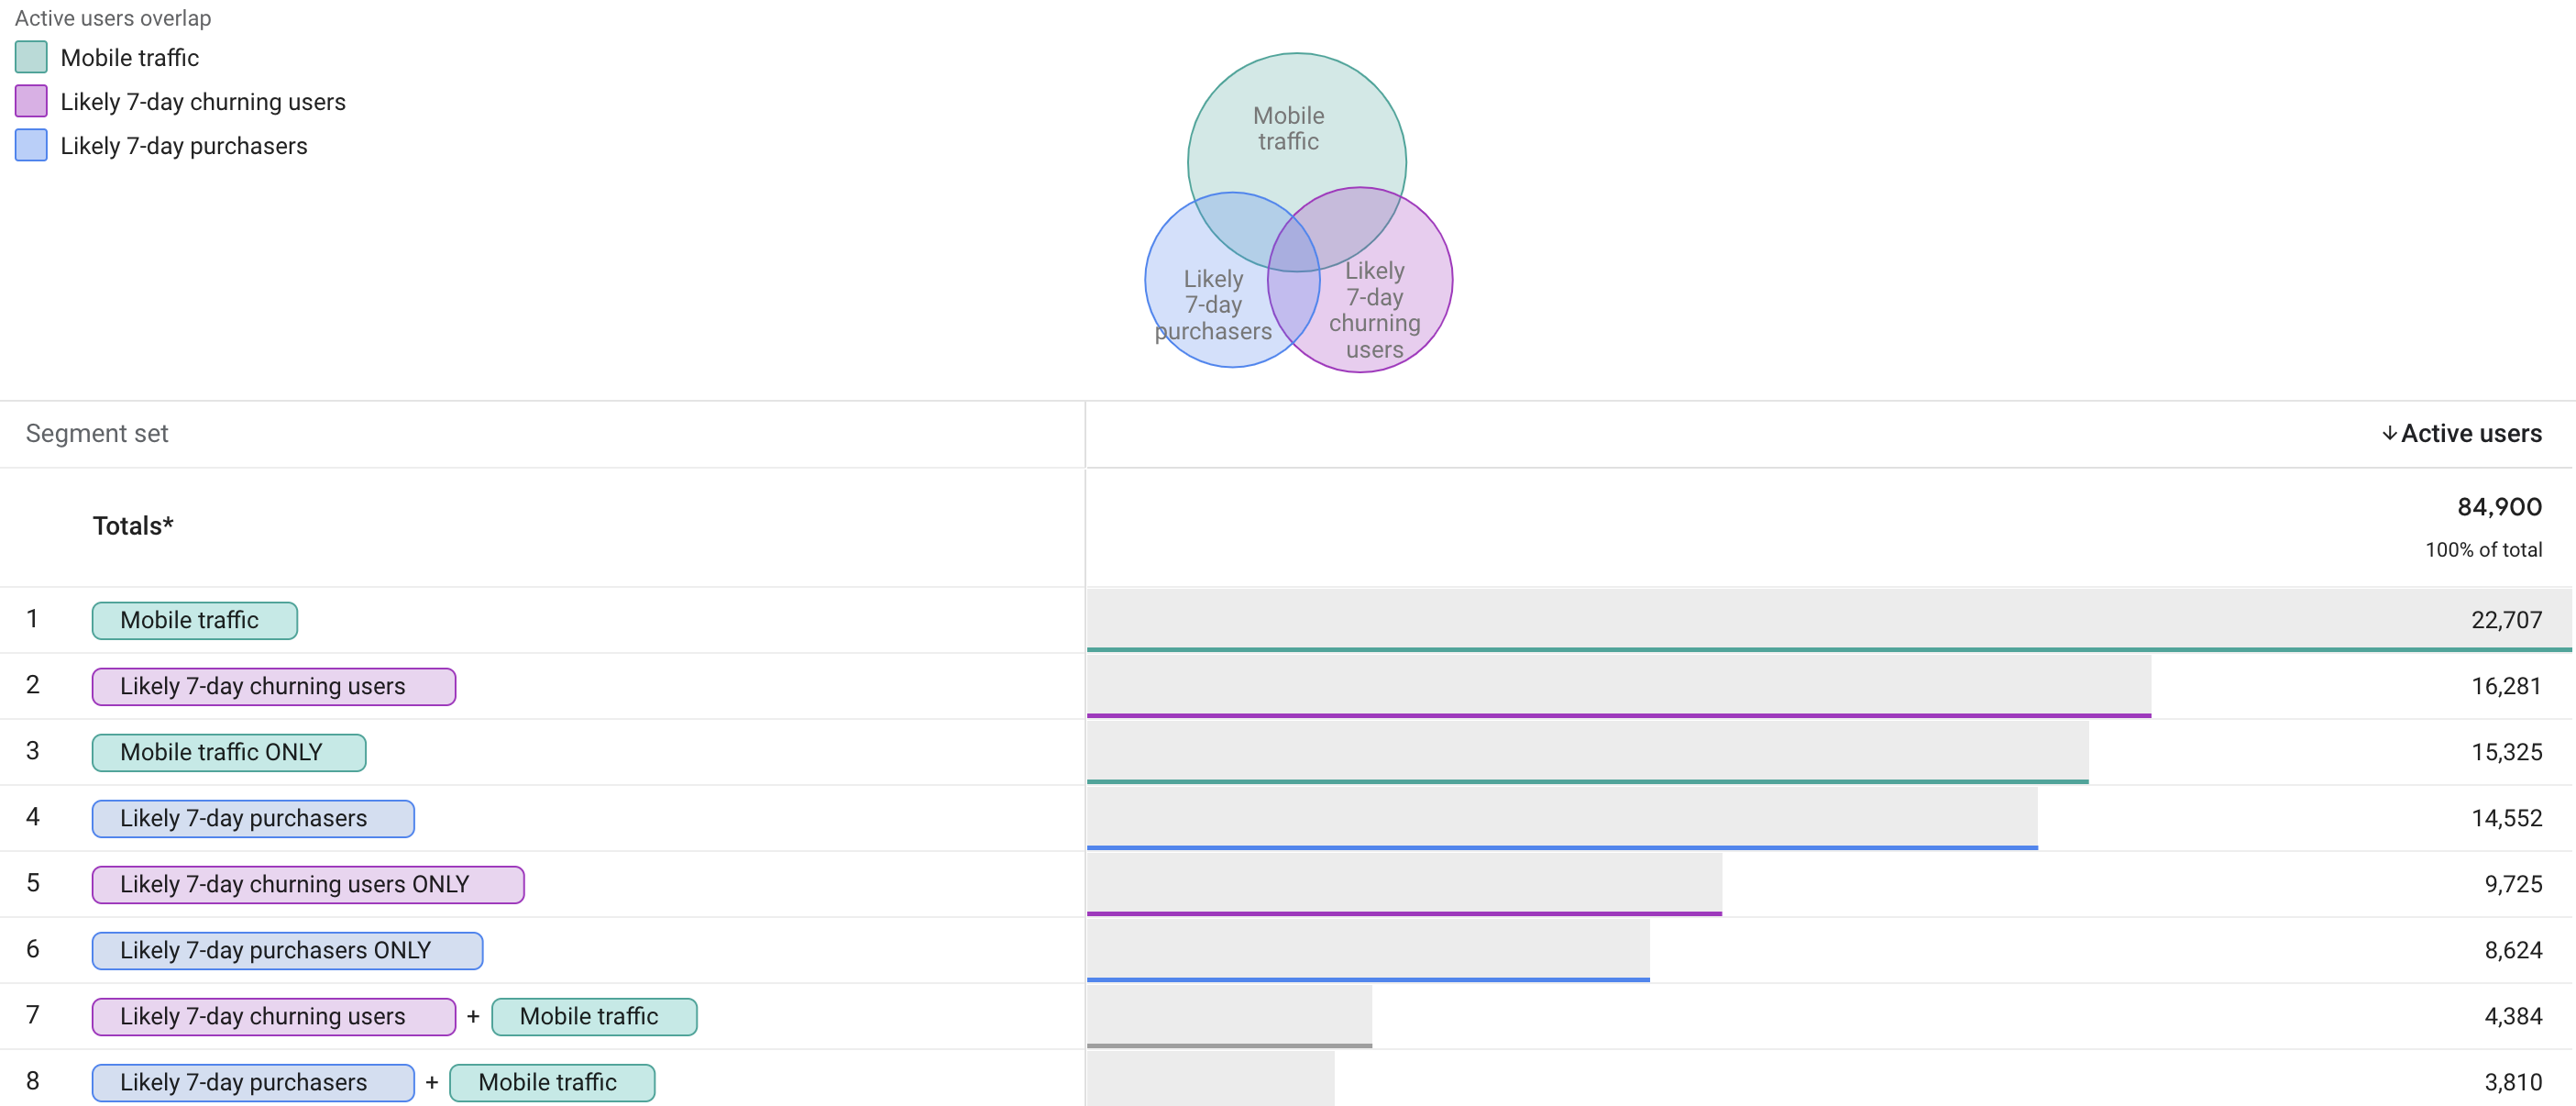
After setting up purchase events, Google will start gathering the data necessary to create predictive audiences for purchasers (and churners) on your site, for example.
Predictive analytics isn’t earth-shattering. Predictive analytics for free? Now that’s a bit of a big deal.

Once populated, you are able to use the predictive audiences as comparative segments throughout all of GA4. You also get access to predictive metrics in Explorations.
2. Create Custom Reports (Not Dashboards)
In Universal Analytics, you have access to custom dashboards and while they’re pretty cool, they aren’t exactly comprehensive.
In GA4, you get access to Explorations (previously Analysis Hub), which enables you to create custom reports. These reports are laid out much like an Excel workbook – tabbed across the top, and each tab with its own unique data.
Explorations allows you to create tables or visualizations for cohorts, paths, funnels, or segments in order to better understand them.
Upon creating a new Exploration report, you can share the report with specific people, print it as a PDF, or download it as an Excel workbook.
3. Create and Track Up to 300 Events
Relying on web developers for everything tracking-related is so 2019. You don’t have to get a developer involved every time you need something tracked with GA4.
In fact, most basic events are already tracked for you in GA4 between the automatically tracked events and enhanced measurement events.
If you don’t see the events you want to track on either of those lists, fear not. You can create new events on the platform.
These events are usually created by modifying an already tracked event or by placing conditions using already tracked parameters.
Perhaps the best news is that you get to create up to 300 of these events per property.

4. Create and Track Up to 30 Conversions
Yes, you can delete them, too!
Conversion tracking in Google Analytics 4 is even more effortless than event tracking. Once the event is tracked in GA4, you can mark it as a conversion by simply toggling it on.
In Universal Analytics, you only have access to tracking 20 conversions (goals) and they are permanent.
In GA4, you can track up to 30 conversions and delete conversions as they’re no longer needed.
5. Customize the Automated Tables
If you got started with Universal Analytics, you’re likely used to seeing tons of tables of data.
While these tables are usually helpful, they aren’t exactly easy to manipulate when you want to see another metric or dimension. Sure, you can add a secondary dimension. But that’s about it.
In Google Analytics 4, anyone with Admin access can customize any of the data presented in any of the reports!
Not only can you dictate the dimensions and metrics used during that session, but you can also actually save the view so that it stays just the way you want to see it.

6. Anomaly Detection
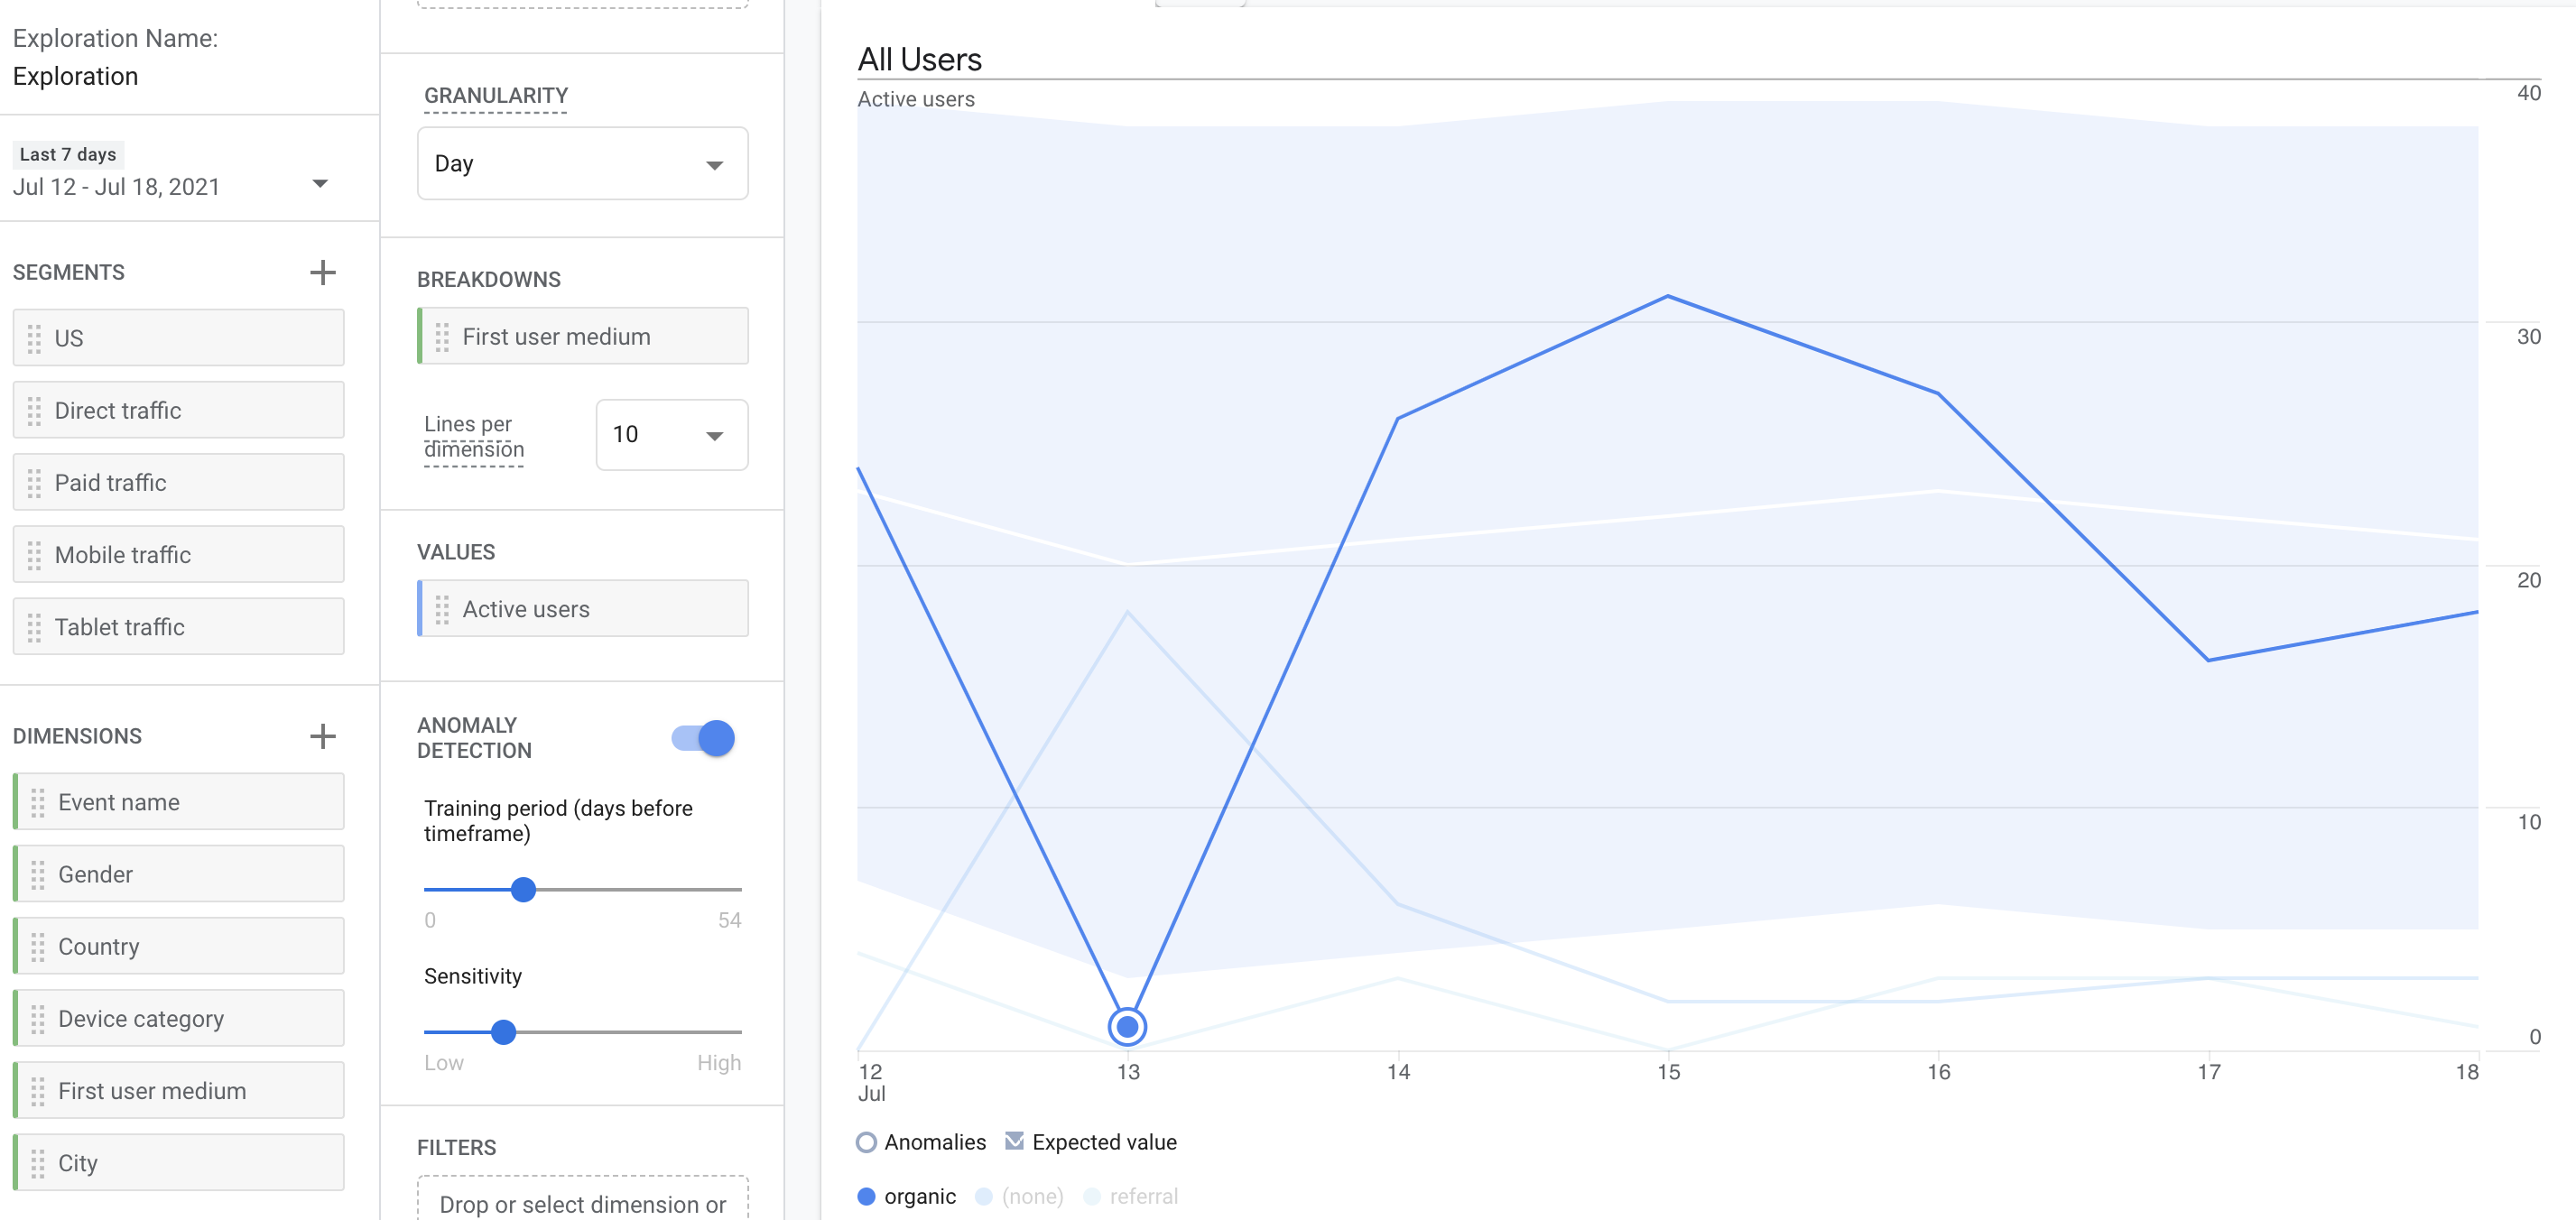
Once again, Google is flexing its machine learning and artificial intelligence muscle. Now, you will see anomaly detection on most line graphs throughout GA4.
Anomalies are detected when Google had an idea of something that was going to happen on your site, but it didn’t.
Were you supposed to make $10,000 a day and didn’t? That’s an anomaly.
This eliminates the need of trying to determine if something was statistically significant. Google is telling you, for free.
At a glance, you are able to see if there is anything you need to look into.
But what would a sweet feature like this be if we couldn’t tap into it in Explorations? In Explorations, you are able to turn on anomaly detection for line graphs and set the sensitivity and learning period.
This is some pretty sweet stuff you can have access to for free. (Did I mention it’s free?)

7. Use Segments Once
A bit of a personal pet peeve of mine in Universal Analytics was that every time I wanted to filter an audience, I had to create a segment.
That wasn’t so bad in itself, except for the fact that the segment was then stored until I deleted it – which I didn’t.
In GA4, you can easily create audience segments without having to save them. This is done using the comparisons tool available on every reporting page.
If you want to create a permanent audience segment, you can do so on the Configuration screen or by creating a segment in Explorations. Select Build an Audience before saving the segment.
What’s Next?
This is a good question. GA4 is still missing features that seem they should be easy enough to create. Things like a Google Search Console integration and site speed metrics seem like a no-brainer, but only time will tell.
Even without some of those more basic features, it’s still time to take a step into GA4.
It’s not ready to be your only analytics platform, but it offers enough to be on your radar and collecting data for you.
Besides, we all know one day Google will make us use it. Might as well prepare now.
More Resources:
- Google Announces New Reporting Features in GA4
- 10 Great Google Analytics Alternatives
- Core Web Vitals: A Complete Guide
Image Credits
All screenshots taken by author, July 2021


