If you’re searching for a list of social media metrics that matter, you’re not alone.
Some social media marketers believe there are three to four that they should turn into key performance indicators (KPIs).
However, while the most common social metrics include engagement, brand awareness, assisted conversions, and sales lift, there are at least 30 you may want to track depending on your marketing strategy.
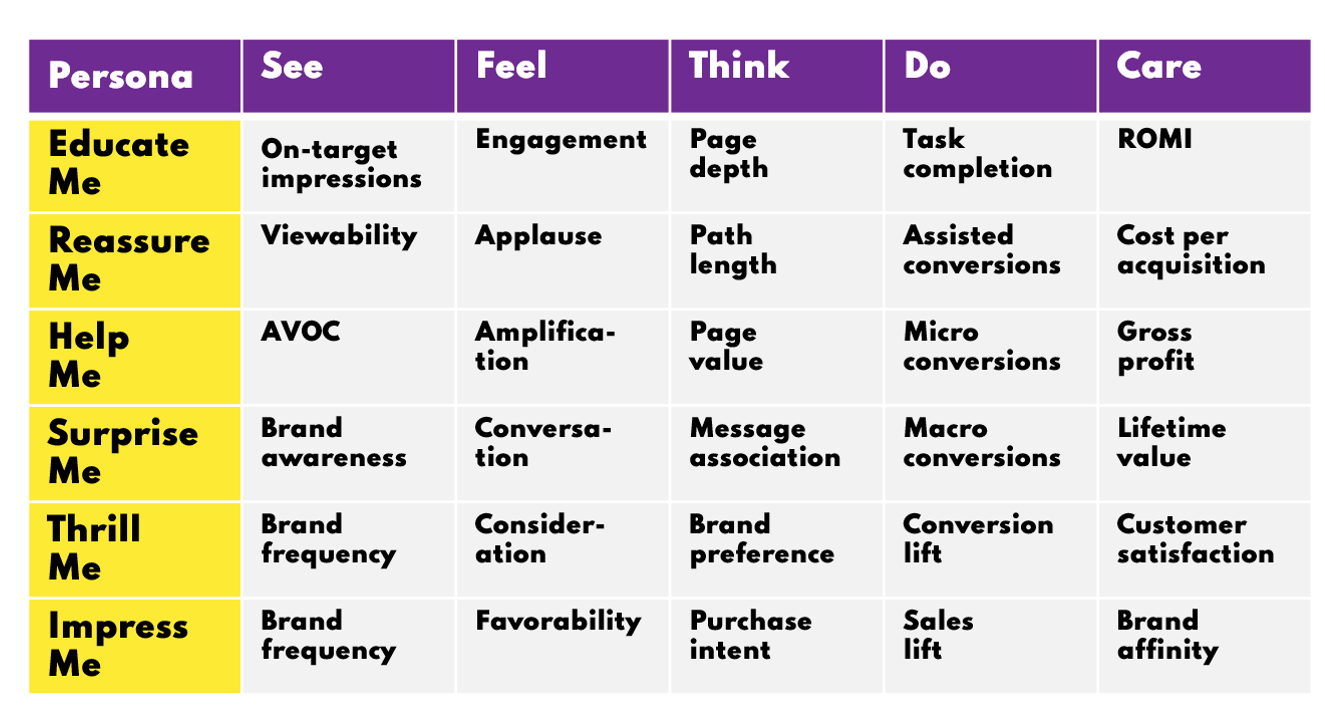
Why do so many metrics matter? Well, it starts with the customer journey, which is why in this column you’ll find these key social metrics mapped out in this way:
In a mythical world, the journey people take to become loyal customers is a straight shot down a highway:
- See your product.
- Consider your product.
- Buy your product.
- Repeat.
In reality, this journey is often more like a sightseeing tour with stops, exploration, and discussion along the way – all moments when you need to convince people to pick your brand and stick with it instead of switching to a competitor.
Here’s an overview of the 30 social media metrics that matter most.
1. Reach
Facebook defines “Reach” as “the number of people who saw your ads at least once. And “Reach” is different from “Impressions,” which may include multiple views of your ads by the same people.
YouTube, on the other hand, defines “Reach” as the number of times your video thumbnails are shown on YouTube.
And YouTube uses the metric “Unique Reach” to measure the total number of people who were shown an ad.
Whichever metric you use, don’t use Facebook Page Likes and Followers to measure reach.
As I explained in Two Social Media Vanity Metrics You Need to Stop Tracking, you’re lucky if a small fraction of your followers even see — let alone engages with — one of your posts or videos these days.
As of the end of 2020, the average reach for an organic Facebook post was 5.2% and the average engagement rate was 0.25%. So, don’t make the mistake of using “Page Likes” as a proxy for “Reach.”
Fortunately, Tubular Audience Ratings use cross-platform uniques to measure de-duplicated audience reach across YouTube and Facebook.
In fact, a new report from the Global Video Measurement Alliance (GVMA) says 53% of social video consumption in the U.S. comes from persons 18-34, compared to just 8% for linear TV.
On the other hand, 66% of linear TV’s audience is 55 or older, while that demographic is only 13% of social video’s audience.
2. On-Target Impressions
Mindel Klein of Colgate-Palmolive has said, “Our target is anyone with teeth.”
If your target market is anyone with teeth, then impressions are metrics that will make you smile.
But if your target segment is women 25-44 in the U.S., it is important to use metrics like on-target impressions, average frequency, and on-target reach (the estimated number of people actually matching your demographic targeting).
The next metric that you should focus on isn’t Views.
On YouTube, a view is counted when someone watches 30 seconds of your video ad (or the duration if it’s shorter than 30 seconds) or interacts with the ad, whichever comes first.
On Facebook and Instagram, a “video view” is defined as three seconds or more.
TikTok counts a “view” as soon as a video starts playing in someone’s feed.
Instead, you should pay attention to an industry-standard metric like…
3. Viewability
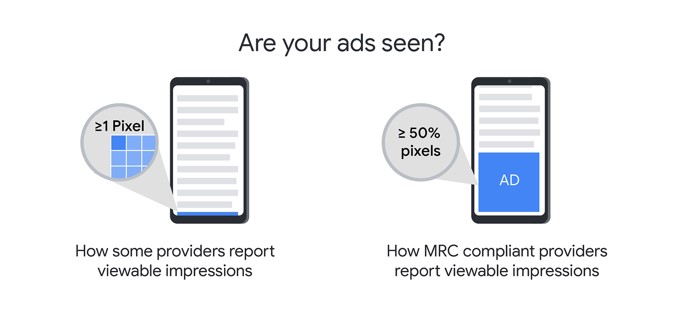
In 2014, the IAB and MRC created a standard definition of ad viewability: At least 50% of an ad must be in view for a minimum of one second for display ads or two seconds for video ads.
And in 2019, Google’s State of Ad Viewability Report found the average viewability for video ads on publishers’ sites was 66%. But videos shown on YouTube had a viewability rate of 95%.
YouTube told publishers that increasing the viewability of their video ads from 50% to 90% can result in more than an 80% revenue uplift (averaged across desktop and mobile sites).
You should also consider adopting an emerging metric developed by the GVMA: Quality views, which has a (30-second view qualifier).
4. Audible and Visible on Complete (AVOC)
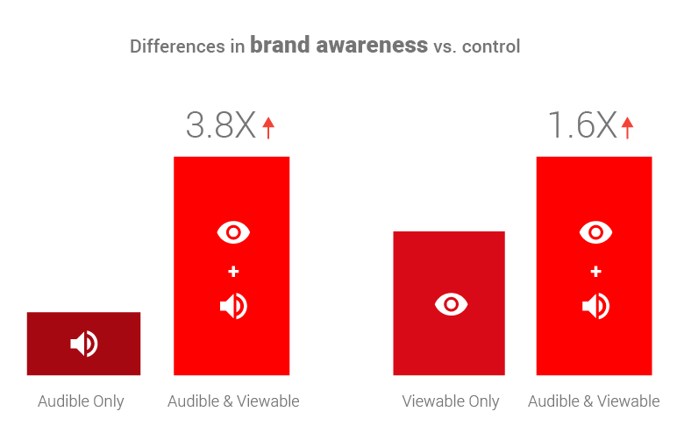
When you think of video ads, you think of sight, sound, and motion. But what happens if someone only sees your ad without hearing it? Or if someone only hears your ad without seeing it?
Well, if a marketer at Google is running a brand campaign, and their goal is to generate awareness, then they track how often an ad was audible and visible on complete (AVOC) since they know from internal testing that this is a more accurate predictor of brand awareness lift.
5. Brand Awareness
This metric measures the portion of a market that can identify a brand either when prompted (aided) or unprompted (unaided).
Example: When it comes to <category>, what brands come to mind?
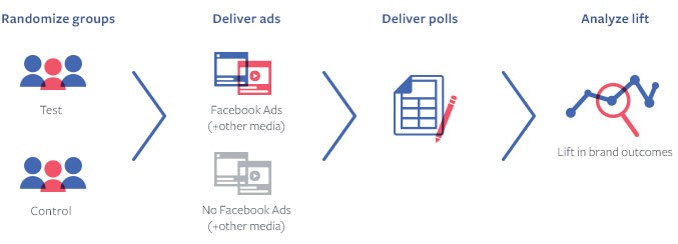
Both YouTube and Facebook offer Brand Lift studies that measure the impact of ads on brand awareness. They work by dividing the people into a randomized test and holdout groups, and comparing the performance of these groups over time.
Now, that’s an advertising metric. If you need a PR metric, then you should use…
6. Brand Frequency
This metric measures how often respondents self-identify hearing about a brand in recent memory across all forms of media.
Example: In the last year, how often have you heard about Burger King?
Then, ask respondents: Where do you get news and information about Burger King? (Select all that apply)
- Friends, family, and colleagues.
- Influencers.
- Television
- YouTube.
- Radio.
- Podcasts.
- Print publications.
- Online publications.
- Search engines.
- Social media.
- Other sources (please specify).
7. Engagement
This is the first metric in the “Feel” stage of the customer journey.
The IAB defines ad engagement as “a spectrum of consumer advertising activities and experiences – cognitive, emotional, and physical – that will have a positive impact on a brand.”
But because engagement is an extremely complex issue, far too many brands buy posts from social media influencers based on the number of followers they have or the number of likes their posts or videos get.
Then, these brands are shocked to find that many influencers are using bad practices such as fake followers, fake likes, bots, and fraud to inflate their numbers.
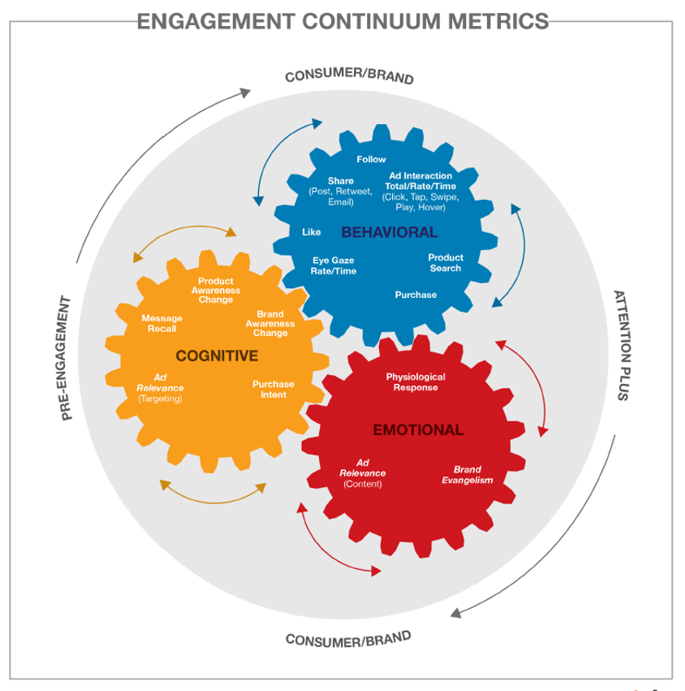
So, which specific metrics should you use to measure engagement?
8. Applause
In a post entitled, Best Social Media Metrics: Conversation, Amplification, Applause, Economic Value, Avinash Kaushik called one of the metrics that we should be using Applause.
This measures how many Likes/Reactions/Hearts each of your posts has received on average. (E.g., Applause rate = 5 means each of your posts has an average of five Likes.)
In other words, “Do users think the content we have posted is interesting?” For example, Expedia’s Facebook page has 6,462,977 followers, but this post got 75 Reactions.
That’s 0.00116% of the page’s followers, but it’s a true measure of the real active engagement of users with their social media pages.

9. Amplification
This is another metric Kaushik calls for at this stage.
It measures how many times on average each of your posts was Shared/Retweeted. (E.g., Amplification rate = 5 means that each of your posts was shared five times on average.)
In other words, “Is what we are saying so incredible and of value that people will stamp their name on it and forward it to everyone they know?”
For example, Chick-fil-A’s Facebook page has 7,775,155 followers. But this post got 73 shares — just 0.000939% of the page’s followers.

10. Conversation
This measures how many Comments/Replies on average each of your posts has received. (E.g., Conversation rate = 5 means each of your posts has an average of five comments.)
In other words, “Is what we are saying interesting enough to spark the most social of all things: a conversation?” For example, Cisco’s Facebook page has 845,921 followers, but this post got one comment.
Since few of their own posts didn’t spark conversations, it may explain why Cisco has sponsored 347 videos in the last three years, according to Tubular Labs data.
If your internal team can’t create engaging content, then consider sponsoring some social media influencers who can.

11. Consideration
This is also a metric you can use a brand lift study to measure.
This measures how consumers weigh different factors in their minds while planning a purchase.
Example: Which factors are important when considering <product category>?
Sibelle Karout and Meriç Demir wrote a piece for Think with Google in July 2020 that tells the story of Namshi, a leading fashion e-tailer in the Middle East.
Namshi focused on the early stages of the shopping journey for generic items like “blue jeans” or “black dress.” By meeting consumer needs at the consideration stage through a display of all product collections, their engagement (the pages viewed per session) rose 81%, and new customer purchases increased 56%.
12. Favorability
You can also use a survey to measure this.
Favorability measures a target audience’s feelings or attitudes towards a company or its products.
Example: How would you describe your overall opinion of Alexa?
- Very favorable.
- Somewhat favorable.
- Neutral.
- Somewhat unfavorable.
- Very unfavorable.
13. Goals
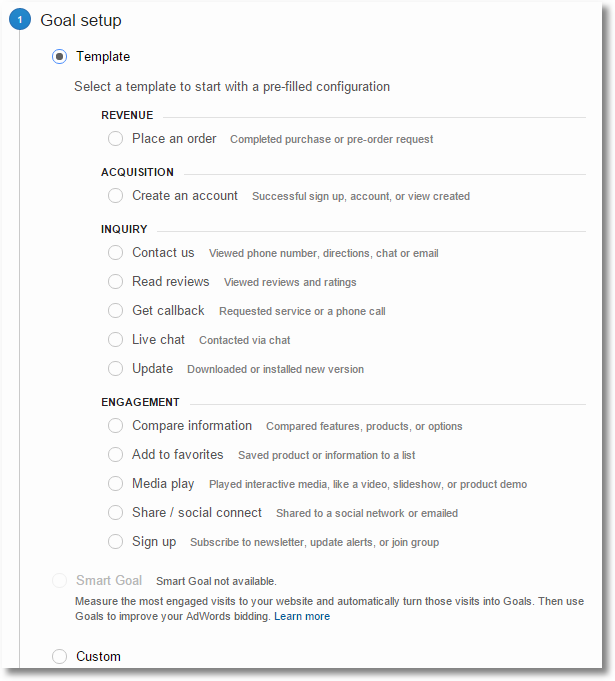
Google Analytics provides many default metrics right out of the box, but you must define your goals and estimate their goal value before Google Analytics can report them.
Google Analytics has Goal templates to help you set actionable goals for standard business objectives.
The four-goal categories are:
- Revenue.
- Acquisition.
- Inquiry.
- Engagement.
14. Page Depth
A very small percentage of visitors to your site will see more than a couple of pages.
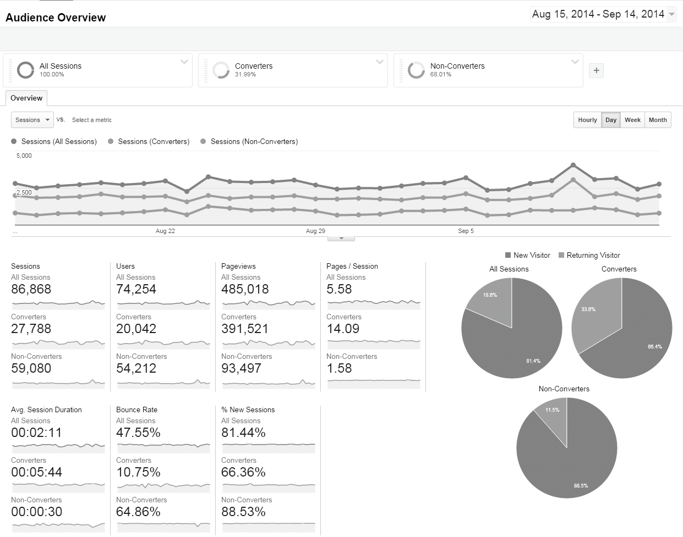
But don’t use the rather useless metrics of Pages/session or Ave. session duration. Instead, use Page Depth.
In Google Analytics, the data you need is here: Audience > Behavior > Engagement > Page Depth tab.
Then, you can analyze this data with segments like Converters and Non-Converters, to compare the two things every site owner cares about: users who convert (complete goals and/or transactions) and users who don’t.
15. Path Length
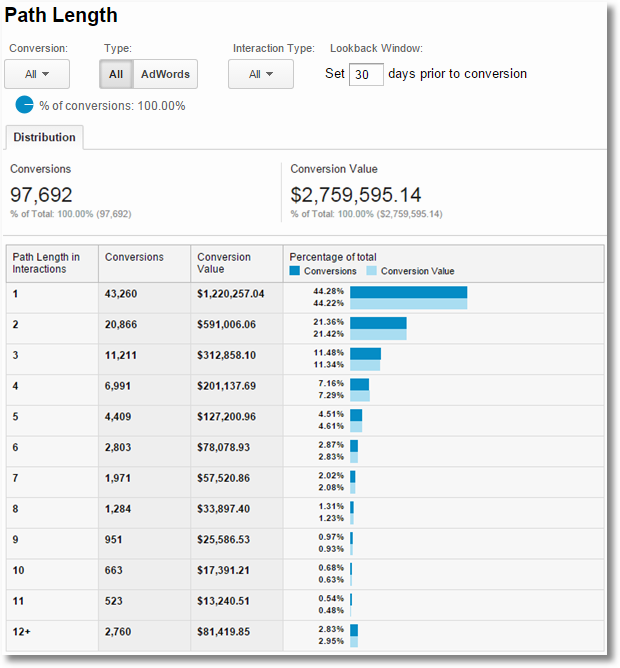
One hidden gem in an ecommerce context is the Path Length report in the Multi-Channel Funnels folder. It shows the number of sessions (visits) it took for a person to convert on your site.
This data has big implications. You can see in the example below that around 44% of the conversions happened on the very first visit.
But if 56% of visitors are going to take longer than one visit to convert, then you should ask yourself: “Did they have a user experience that makes a second visit likely, or do you need to make changes to improve your website?”
16. Page Value
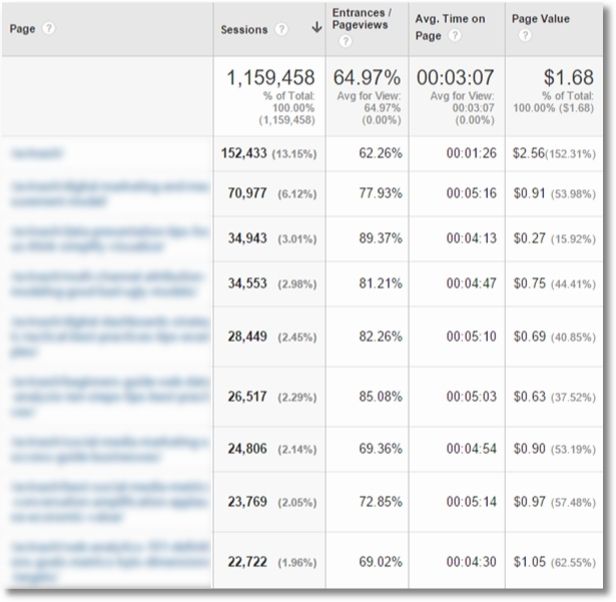
This measures how frequently a page appears in a session where a goal is completed by a user. The more frequently the page appears, the more helpful that page must have been to the user.
In the example below for Kaushik’s Occam’s Razor blog, you can see the disparities in Page Value in the last column.
They range from $0.27 to $2.56.
You finally have a metric that looks at every bit of content with an eye towards the bottom line.
17. Brand Preference
At this stage of the customer journey, you can also use surveys to measure Brand preference.
This measures the relative preference among respondents between a list of given brands in a product category.
Example: Which <product category> company do you prefer?
Why measure brand preference in addition to brand awareness? Well, in an article published by Think with Google in November 2019, the authors said a study by Kantar found that while consumers may be aware of many different online retailers, they actually end up buying from just a select few.
In other words, establishing your brand in people’s minds doesn’t necessarily mean they’ll end up buying from you.

18. Purchase Intent
And you can also use a brand lift survey to measure Purchase intent.
This measures the respondent’s attitude toward buying a product or service. Example: Will you buy (brand) the next time you shop for (category)?
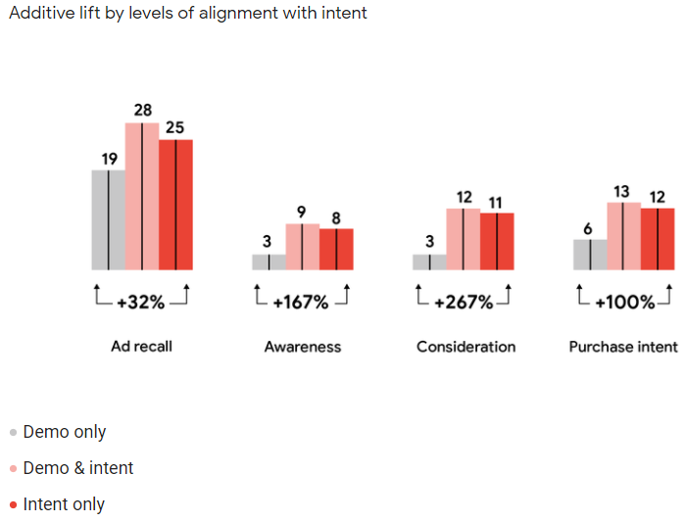
A study conducted by Google and Ipsos found that video advertising based on a shopper’s interests and intent drove significantly higher impact than those served using demographics only, with 100% higher lift in purchase intent.
Interestingly, the addition of demographics to intent did not produce a significant incremental lift versus using intent alone.
19. Task Completion
In this stage of the customer journey, this is the first metric to use.
Google Analytics shows you what visitors do, but it can’t tell you why.
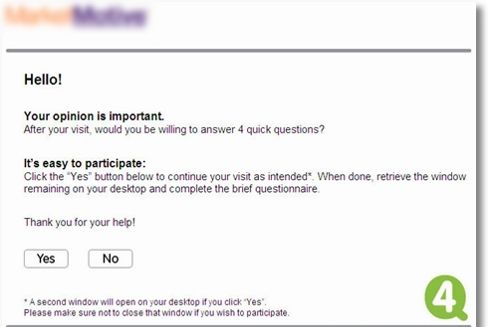
But, you can conduct a website survey for free that asks visitors three key questions about task completion. In a July 2015 post, Kaushik said the key questions are:
- What is the purpose of your visit to our website today?
- Were you able to complete your task today?
- (Conditional, if No) Why were you not able to complete your task?
- (Conditional, if Yes) What could we have done to make your experience delightful?
20. Assisted Conversions
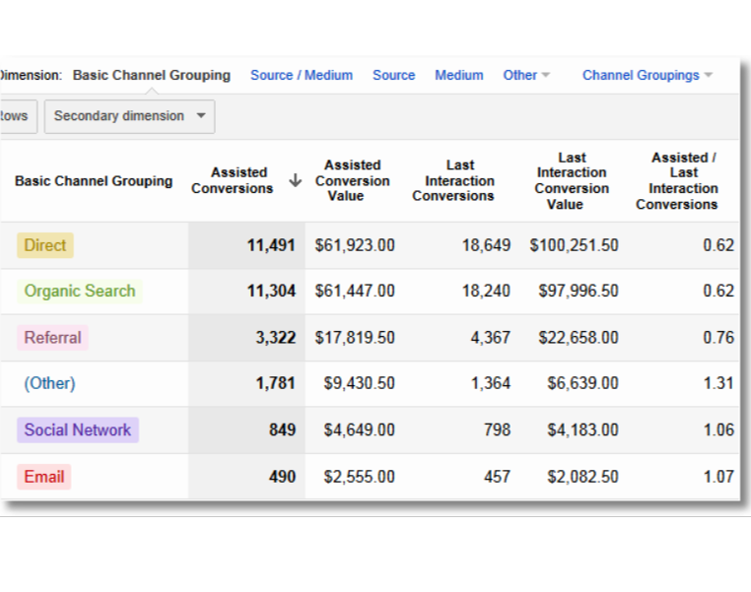
This measures the number (and monetary value) of conversions a channel assisted. If a channel appears anywhere on a conversion path (except as the last interaction), it is considered an assist.
In Google Analytics, go to the Conversions tab, then Multi-Channel Funnels, and finally click on Assisted Conversions.
The report gives credit to channels for introducing new customers to your business and working hard in the early part of the conversion journey, as well as credit if they also drive the last visit that resulted in a conversion.
21. Micro Conversions
This measures a completed activity such as email signup, form submission, download, link click, or video play, which indicates the user is moving towards a purchase transaction.
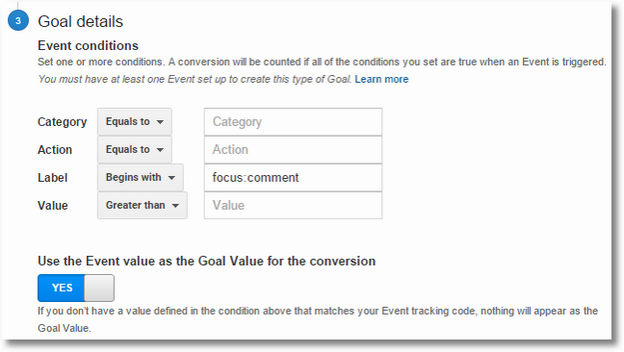
One way to determine the goal value of a micro conversion is to evaluate how often the users who complete the goal become customers.
For example, if your sales team can close 10% of the people who sign up for a newsletter, and your average transaction is $500, then you might assign $50 (i.e. 10% of $500) as your newsletter sign-up Goal Value.
Then, you should use the metric: Macro conversions.
22. Macro Conversions
This measures completed purchase transactions, ecommerce orders, leads submitted for a B2B company, new profiles opened by a visitor to a content site, or donations on a non-profit site.
Now, if social media marketers mistakenly think that this is a mythical metric, then they should Ronnie Gomez’s What Is Social Commerce? The Stats, Examples and Tips You Need for 2021. In it, Gomez said social commerce is moving social media beyond its traditional role in the discovery process by encouraging users to complete the entire purchase process without leaving their preferred apps.
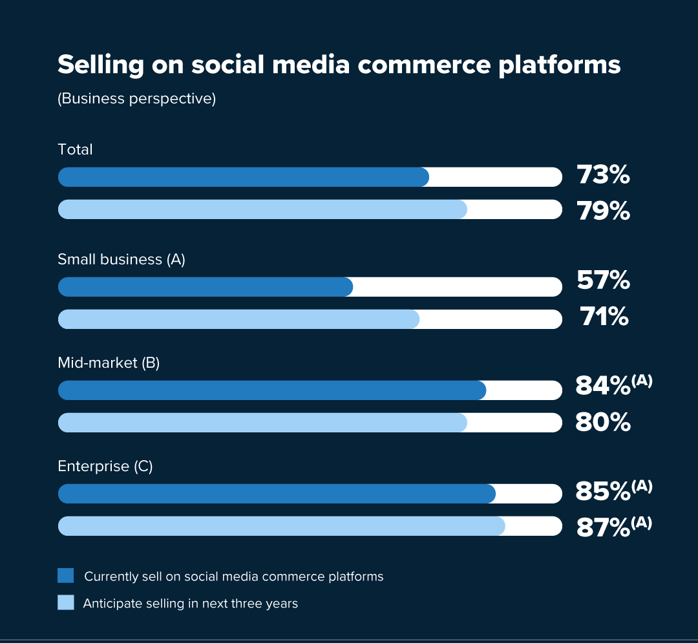
And according to Sprout Social’s latest State of Social Media Report, about 8 in 10 business executives expect to be selling their products or services via social within the next 3 years.
23. Conversion Lift
This is a metric you can use surveys to measure.
It measures the impact of your ads on driving user actions, such as website visits, sign-ups, purchases, and other types of conversions. It is available for YouTube, Facebook, and Instagram.
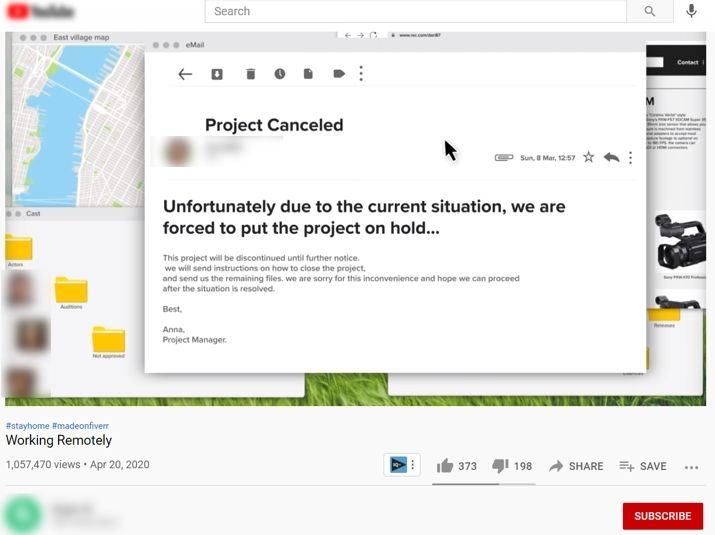
For example, Fiverr, one of the world’s largest marketplaces for freelance services, wanted to drive both consideration and website engagement.
They ran YouTube ads to reach audiences throughout the funnel and used Brand Lift and Conversion Lift to measure full-funnel impact. Their first test delivered a 10% lift in consideration and a 30% lift in new users.
24. Sales Lift
In some industries, you can use surveys to measure Sales lift. This measures, in aggregate, how effective Facebook, Instagram, and YouTube ad campaigns are at moving consumer packaged goods off the shelves in a privacy-safe way.
For example, Blue Bunny Ice Cream used a Nielsen Brand Effect study and an Oracle sales lift study to measure their Facebook and Instagram video ads.
The April 1–June 30, 2019 campaign generated:
- 6-point lift in top of mind awareness.
- 4% lift in spend per household.
- 3% lift in the percentage of households buying.
25. ROMI
Now, few topics generate as many deer-in-headlights looks from social media marketers as ROI. But, the right metric to use is “ROMI.”
Return on Investment (ROI) metrics measure money that is “tied up” in plants and inventories (capital expenditure or CAPEX).
But, Return on Marketing Investment (ROMI) metrics measure money spent on marketing, which is typically expensed in the current period (operational expenditure or OPEX).
ROMI = [Incremental Revenue Attributable to Marketing ($) * Contribution Margin (%) – Marketing Spending ($)] / Marketing Spending ($).
You’ll find an example in an article I wrote about Kim Kardashian West’s #sponsored Instagram post for Gummy Hair Vitamins, which cost SugarBearHair $500,000.
If their contribution margin was 50%, then the #sponsored post needed to generate $2 million in orders for SugarBearHair to see $1 in profit for every $1 it spent. ($2 million * 50% – $500,000) / $500,000 = an ROMI of 1.)
26. Cost per Acquisition
This measures the aggregate cost to acquire one paying customer on a campaign or channel level. For the cost of social media marketing, use the total salary of the social media team.
In a post on Occam’s Razor, Kaushik said,
“Obsess about this metric. You have very little money. You need to know, obsessively, what you get for it. This metric delivers that insight.”

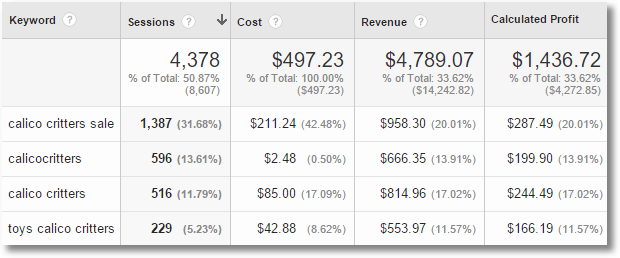
27. Gross Profit
Gross profit is a metric you will also want to get comfortable using.
This measures the income or profit a company makes after deducting the costs associated with making and selling its products, or the costs associated with providing its services.
Normally, gross profit only appears on a company’s income statement. But you can use the Google Analytics Calculated Metrics feature to calculate this metric by subtracting the cost of goods sold (COGS) from revenue (sales).
28. Lifetime Value
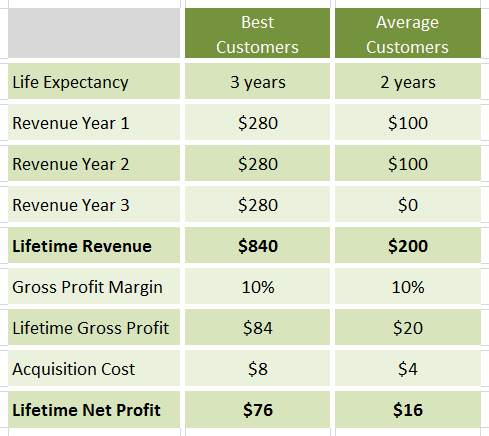
Lifetime value measures how valuable different users are to your business based on lifetime performance.
For example, you can compare users acquired through organic search and social media.
And Wharton Marketing Professor Peter Fader says,
“Because costs are so tangible and (Customer Lifetime Values) are a mere prediction, it’s really hard to get firms to adopt this mindset. But it’s the right one.”
Get comfortable with Lifetime Value as the key driver to customer acquisition, retention, and development decisions.
29. Customer Satisfaction
Using surveys, you can also use the metric Customer satisfaction.
This measures what your customers think about your brand, products, or services.
Example: Do you agree or disagree that Lacoste meets my fashion needs better than Ralph Lauren?
- Strongly agree.
- Somewhat agree.
- Neither agree nor disagree.
- Somewhat disagree.
- Strongly disagree.
30. Brand Affinity
And finally, you can use surveys to measure brand affinity.
This measures an individual’s brand preference in a product category, which tends to retain loyal customers for longer. Example: “How do you feel about Nike?”
- I love it.
- I like it.
- I’m neutral.
- I don’t like it.
- I hate it.
Put all of this together and you get the Social Media Metrics Matrix that appeared at the beginning of this post.
Conclusion
I ran a draft of this matrix by three experts, whose feedback I incorporated into this post:
- Avinash Kaushik, Head of Strategic Analytics at Google Marketing.
- Michael Stebbins, Chairman of OMCP.
- Katie Delahaye Paine, AKA, “The Measurement Queen.”
But, I admit that I’ve just selected the 30 most important social media metrics out of the 46 of the most commonly used business metrics that Kaushik mentions in his 2018 post, “The Impact Matrix | A Digital Analytics Strategic Framework.”
That’s right — there are more social media metrics than you can shake a stick at.
Deciding which ones matter at different stages of the customer journey requires that you spend time and thought with the top executives in your company or clients, as well as your entire social media marketing team.
Remember: If you don’t make this investment soon, you will continue being forced to “judge a fish by its ability to climb a tree.”
More Resources:
- 12 Social Media Engagement KPIs That Matter
- How to Measure the ROI of Your Social Media Marketing Efforts
- Social Media Marketing: A Complete Strategy Guide
Image Credits
Image 3: thinkwithgoogle.com
Image 4: about.fb.com
Image 5: theonlineadvertisingguide.com
Image 13: thinkwithgoogle.com
Image 18: sproutsocial.com
All screenshots taken by author, July 2021


![[SEO, PPC & Attribution] Unlocking The Power Of Offline Marketing In A Digital World](https://www.searchenginejournal.com/wp-content/uploads/2025/03/sidebar1x-534.png)